The numbers just don’t add up. Even if you treat this stuff on the most charitable of terms, dollar for dollar, way too much of the hole almost certainly remains unfilled. That’s the thing about “stimulus” talk; for one thing, people seem to be viewing it as some kind of addition without thinking it all the way through first. You have to begin by sizing up the gross economic deficit it is being haphazardly poured into – with an additional emphasis on “haphazardly.” Everyone forgets the last time when the government tried this, impressing markets and the media with its huge numbers, that after it was over its proponents complained how it wasn’t big enough. Paul Krugman most of all (seriously, in November 2009, long afterward, he wrote Obama’s plan was awesome
Topics:
Jeffrey P. Snider considers the following as important: 5.) Alhambra Investments, CARES Act, COVID-19, currencies, economic dislocation, economic output, economic shock, economy, Featured, Federal Reserve/Monetary Policy, Fiscal spending, Markets, newsletter, Nominal GDP, real GDP, stimulus
This could be interesting, too:
Nachrichten Ticker - www.finanzen.ch writes Die Performance der Kryptowährungen in KW 9: Das hat sich bei Bitcoin, Ether & Co. getan
Nachrichten Ticker - www.finanzen.ch writes Wer verbirgt sich hinter der Ethereum-Technologie?
Martin Hartmann writes Eine Analyse nach den Lehren von Milton Friedman
Marc Chandler writes March 2025 Monthly
|
The numbers just don’t add up. Even if you treat this stuff on the most charitable of terms, dollar for dollar, way too much of the hole almost certainly remains unfilled. That’s the thing about “stimulus” talk; for one thing, people seem to be viewing it as some kind of addition without thinking it all the way through first. You have to begin by sizing up the gross economic deficit it is being haphazardly poured into – with an additional emphasis on “haphazardly.” Everyone forgets the last time when the government tried this, impressing markets and the media with its huge numbers, that after it was over its proponents complained how it wasn’t big enough. Paul Krugman most of all (seriously, in November 2009, long afterward, he wrote Obama’s plan was awesome but it wasn’t “nearly enough”). If you don’t know how big is the abyss, if you can’t even size the thing up properly while it’s unfolding, how can you even attempt to call it “stimulus?” What we are dealing with today is an economic disruption the proportions of which are an historical outlier. That means an unfathomable number of workers are not getting paid and therefore consumers not spending, businesses don’t collect that revenue which destroys their profit levels, and then business investment which doesn’t get done on top of both consumers and businesses far more likely to save and act differently than before. |
GDP Pro Forma, 2010-2020 |
| The federal government (we’ve done the Fed’s “stimulus” a million times over already) is attempting to bridge this enormous divide by making up what it hopes ends up being the vast majority of this difference. For workers that aren’t working and therefore not being paid, the government offers souped-up unemployment benefits and safety nets. “Helicopter” payments to citizens. Business loans and grants in lieu of revenue that will never happen.
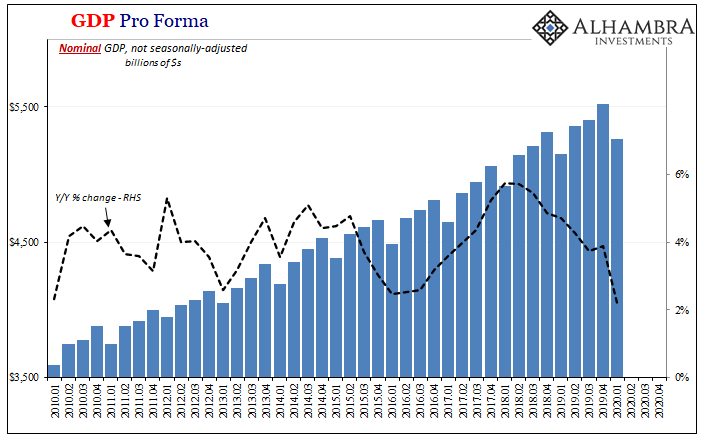
The feds aren’t adding to an economy experiencing a mild downturn, and therefore create an excess, they’re trying desperately to redistribute a sufficient amount just to be able to hope they can keep this thing afloat long enough (For what? No one wants to answer, the goalposts continue to shift.) The stock market like many commentators are all saying the government’s done more than enough, perhaps too much (inflation). That all depends first upon the scale of the hole.We’re going to use unadjusted nominal GDP in this pro forma exercise because that’s really what ends up being lost. Inflation, or deflation, as this case may be, doesn’t factor as much on the ground since we’re trying to figure out the level of gross activity that won’t happen – and then compare the government’s efforts to it. What gets reported in the media as real GDP is really inflation-adjusted, seasonally-adjusted at an annual rate. The unadjusted figures provide us with a more suitable basis; in Q1, for example, the headline estimate for nominal GDP was $21.5 trillion when, unadjusted, total output was actually a shade less than $5.3 trillion. |
GDP Pro Forma, 2010-2020 |
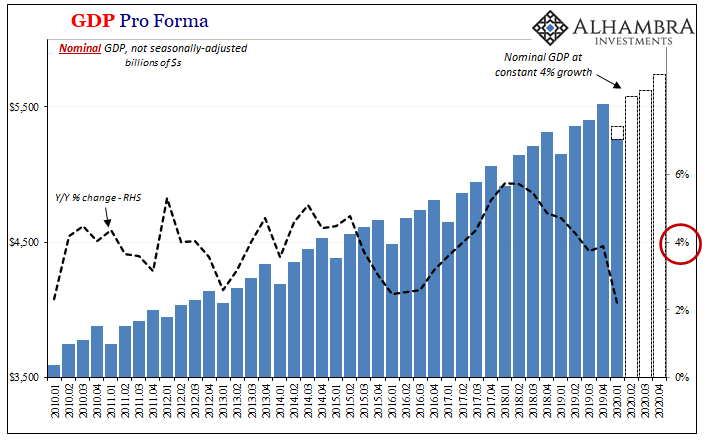
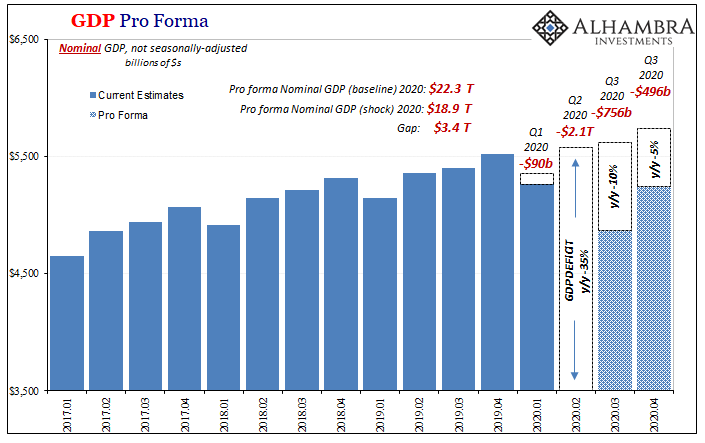
| And, as you can see above, the trend in US output was unfavorable to begin with. The American economy, like the rest of the world, slowing down considerably before the end of 2019. For our purposes, then, we’ll use a conservative 4% nominal growth rate as our forward-looking baseline (rather than a more realistic “boom” of closer to 7% or 8% like before 2008).
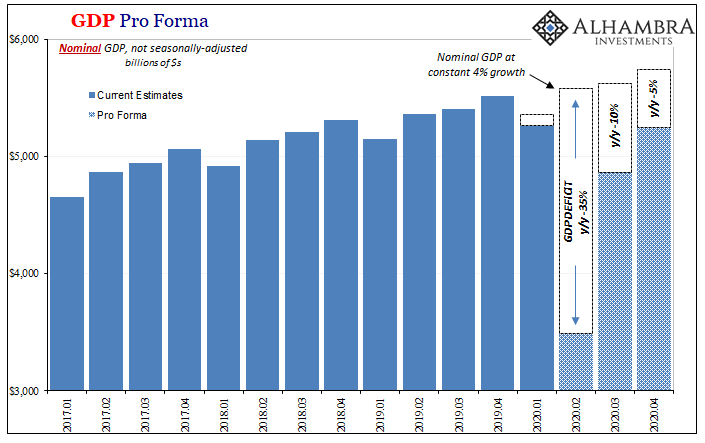
This gives us what GDP might’ve looked like if COVID-19 hadn’t happened and the prior slowdown hadn’t become worse. Now, the tricky part. According to several sources, including the Atlanta Fed’s GDPNow tracking model, Q2 GDP is looking like -40% to -45% right now. Those estimates are for real GDP seasonally-adjusted, so we’ll conservatively use -35% year-over-year in our pro forma unadjusted set, giving us a cushion of error in the government’s favor (smaller relative “hole”). In Q3, we’ll expect an “explosion” of growth, the best ever seen (without context), which leaves nominal unadjusted GDP 10% less than Q3 2019, and then 5% below the previous year in Q4. |
GDP Pro Forma, 2017-2020 |
| These latter two quarters don’t matter as much as you might think.
This would put nominal output back in the right direction very quickly and sharply, leaving the economy very nearly equal to Q1 when this whole thing started. But it’s not about what the level might be by Q1 2021, the entire issue is what amount gets lost in between – and how much the government must try to make up for it – for the rest of this year (and into next year, probably). |
GDP Pro Forma, 2017-2020 |
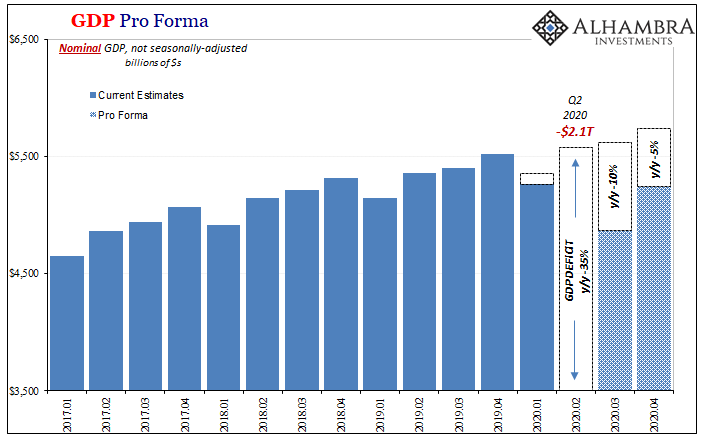
| For Q2 alone, the gap is $2.1 trillion – as a starting point. Two point one TRILLION in lost direct economic output. Not an annual rate, not seasonally-adjusted; gross nominal spent and invested dollars that have vanished and will continue to disappear.
If we tally up the rest of the year, quarters one through four, this scenario leaves us expecting just $18.9 trillion in total output compared to the $22.3 trillion under our 4% growth baseline – for a yearly difference in lost activity of somewhere around $3.4 trillion. On this scale, it really doesn’t make much difference if it ends up being something like $2.5 trillion. But it certainly does if, using less moderate estimates, the gap tallies $4 trillion or more. |
GDP Pro Forma, 2017-2020 |
| That’s, in my view, a conservative estimate for a difference the government’s got to try and make up for; lost economic activity that much of which we will never get back.
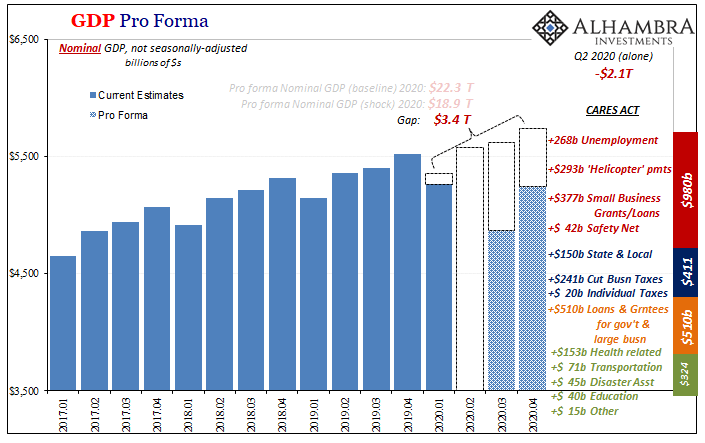
The hopes for a “V” instead rest almost entirely upon the CARES Act. The proportions of this “stimulus” spending amount to about $2.2 trillion give or take. Why give or take? Because this stuff is done in round numbers, haphazardly slapped together by guesses and pork barrels. Which industry wants the bailout the most by hiring the best lobbyists? |
GDP Pro Forma, 2017-2020 |
| In terms of direct payments to consumers, workers and small businesses, that comes out to just less than $1 trillion (red above). Then it gets more questionable with tax cuts and local/state government bailouts (blue), not quite the kinds of federal “spending” that becomes actual spending.
Beneath those, loan guarantees for governments as well as larger businesses; more liquidity and cash-sourcing than stimulus (orange). Finally, the substantial add-ons (green) at the end, the list of “other” which includes the airline bailout, healthcare spending, education grants (!), as well as huge money ($45 billion) directed to FEMA for “disaster assistance.” A mish-mash of activities that don’t exactly re-create the flow of income and revenue a normal, healthy economy transmits. |
GDP Pro Forma, 2005-2010 |
Even if we consider every single dollar as if it gets issued and becomes a dollar spent or distributed (which won’t happen) into this enormous real economic gap, that’s a little over $2.2 trillion combined which barely covers the second quarter’s deficit. And that’s if everything goes right and before we even consider the differences in timing (something about “shovel-ready” rings a bell).
Economists will try to claim there are multiplier effects through all of this activity, which are supposed to further boost the impact of these big numbers even if they don’t end up being one-to-one. But even if there is some positive multiplier, how much of it is, as experience has shown, canceled out by negative multipliers associated with a -35% nominal decline?
The country’s experience with ARRA should have been enough to put that myth to bed for good (as well as the Bush “tax credits” payments, up to two-thirds of which were saved rather than spent).
Again, even if we assume dollar for dollar the government’s spending hits the real economy in gross nominal output, that still leaves a deficit of substantially greater than $1 trillion. It’s no wonder the constant government talk of having to do more; the hole really is this big.
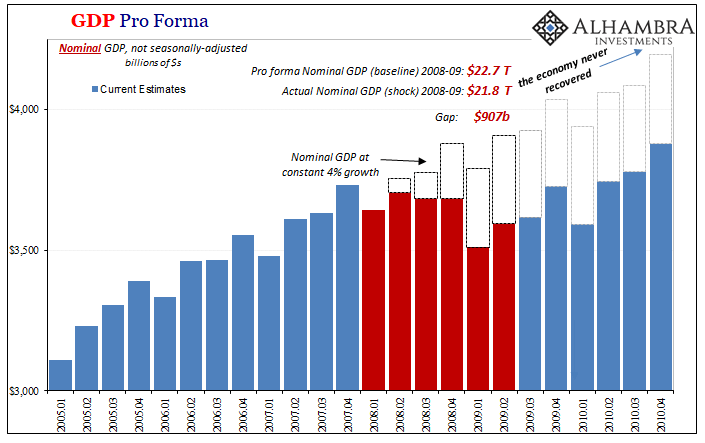
To put this into context, let’s compare it to the same exercise run using the Great “Recession.”
Keeping it to only the six quarters officially declared as recession (Q1 2008 up to and including Q2 2009), the total amount of lost output back then was about $900 billion (assuming the same conservative 4% baseline). And, importantly, we have to stop with those six quarters because, as you can see above, the recovery never came; the economic deficit was never filled, not even close, and had continued onward until the present time despite layers and layers of “stimulus.”
The ”L”, in other words, where before all the Fed’s and feds’ “inflationary” “stimulus” was assumed to be effective, too. Wrongly, as it turned out.
When dealing with numbers this big, precision isn’t nearly so important. Rough guesses and spit-balling are a good place to start because in this size of a ballpark even getting close should open your eyes.
Under what I’d consider the best possible scenario, dollar for dollar government stimulus, un-multiplied but parred up, this would still leave us with a gap somewhat bigger than the one (on a percentage basis) we call the Great “Recession.” If everything goes just perfectly, including the best economic “growth” ever seen in Q3, we’ll be lucky if it totals up to be a repeat of the 2008 and early 2009 experience in the economy.
That’s not a “V” and just the scale of these numbers were a big reason why the Great “Recession” didn’t produce one, either. If my numbers end up being in the same ballpark, this explains the deflationary circumstances all-too-well. Doesn’t matter how big the government “rescue”, the economy has already gone one (trillion) bigger (in the hole).
Tags: CARES Act,COVID-19,currencies,economic dislocation,economic output,economic shock,economy,Featured,Federal Reserve/Monetary Policy,Fiscal spending,Markets,newsletter,Nominal GDP,real GDP,stimulus

