Today we are taking our monthly look at the charts for gold and silver. We have now received news of 3 Covid19 vaccines that are seeking approval following successful trials and markets have sat up and listened. Investors have moved in to “Risk On” mode as a result of the vaccine developments and also on signs that the transition to the Biden administration is now progressing better than previously. While stock markets, oil markets and cryptos have benefitted from this renewed positive sentiment, the precious metals have been sold down as a result. First let’s take a look at the gold price chart… The support level at ,860 which had help on a number of occasions recently, eventually succumbed to the positive news cycle and heavy selling. GoldCore Gold Chart -
Topics:
Stephen Flood considers the following as important: 6a.) GoldCore, 6a) Gold & Bitcoin, Daily Market Update, Featured, gold chart, gold price chart, newsletter, silver chart, silver price chart
This could be interesting, too:
Nachrichten Ticker - www.finanzen.ch writes Die Performance der Kryptowährungen in KW 9: Das hat sich bei Bitcoin, Ether & Co. getan
Nachrichten Ticker - www.finanzen.ch writes Wer verbirgt sich hinter der Ethereum-Technologie?
Martin Hartmann writes Eine Analyse nach den Lehren von Milton Friedman
Marc Chandler writes March 2025 Monthly
| Today we are taking our monthly look at the charts for gold and silver.
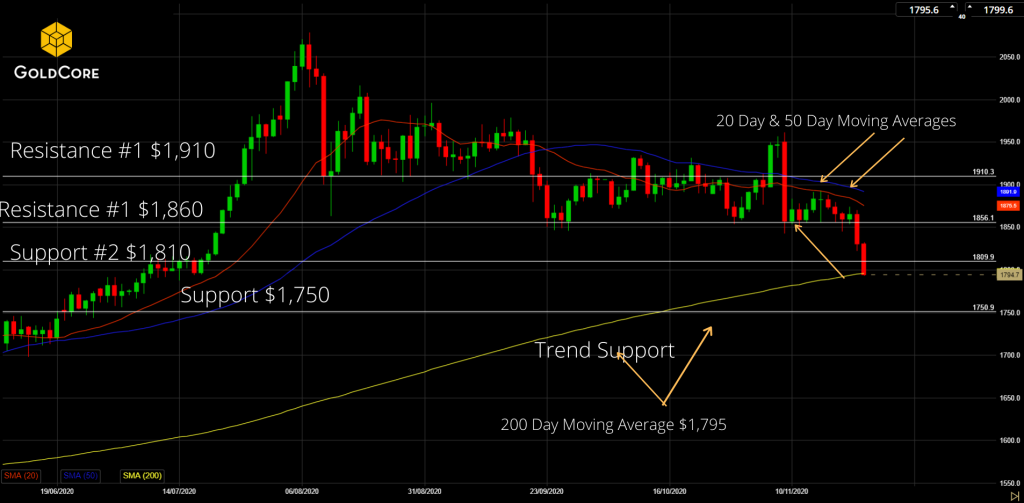
We have now received news of 3 Covid19 vaccines that are seeking approval following successful trials and markets have sat up and listened. Investors have moved in to “Risk On” mode as a result of the vaccine developments and also on signs that the transition to the Biden administration is now progressing better than previously. While stock markets, oil markets and cryptos have benefitted from this renewed positive sentiment, the precious metals have been sold down as a result. First let’s take a look at the gold price chart… The support level at $1,860 which had help on a number of occasions recently, eventually succumbed to the positive news cycle and heavy selling. |
GoldCore Gold Chart |
| Intra-day today the next support level at $1,810 was breached and gold traded down to the 200 Day Moving Average at approx. $1,795.
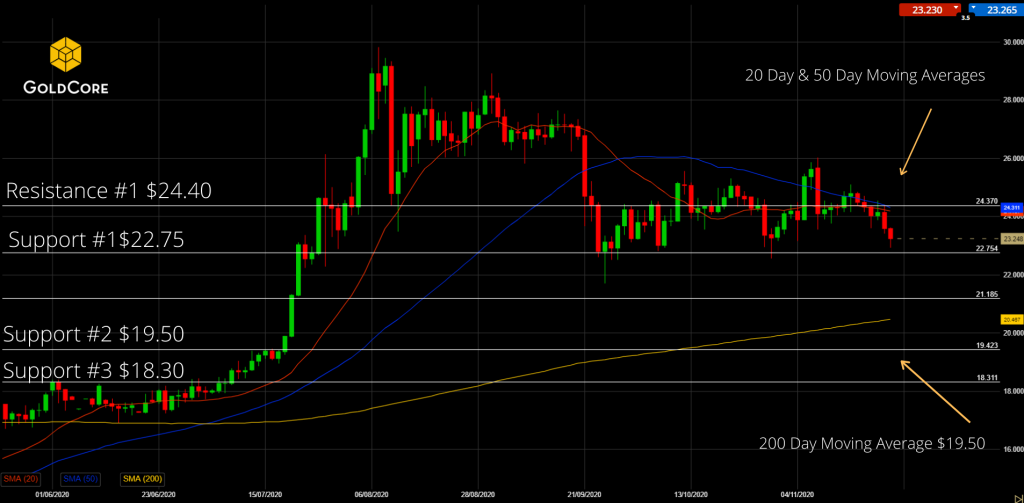
We will be watching closely to see if gold can rally from here and close the day above $1,810 or the $1,795 level. Failure to do so may open up the opportunities get in to the market at lower levels near the next support at $1,750. Meanwhile, silver is trying hard to stay above support at $22.75. As we have mentioned before, a breach of this level could present further opportunities to buy silver at lower prices as there is little in the way of technical support nearby, below here. A breach of $22.75 could set up a test of support of $21.20 or $19.50 below this. |
GoldCore Silver Chart |
What You Need to Know about “The Great Reset”However, if silver holds and rallies from here it would be further evidence of a strong consolidation which would build a nice base for the next inevitable leg higher for the white metal. The news cycle is moving very fast at the moment and with the vaccine news circulating widely this may lead to complacency in behaviour, which in turn may see a rise in Covid19 cases. Regardless of anyone’s individual view on the management of the virus or political persuasions, we can guarantee that policy makers will act to further contain the spread of the virus if this happens. This will have unintended consequences for our economies, and financial markets and the short-term positive news cycle will change very quickly once again. More important than the short-term vagaries of the markets are the long-term market developments. In this months episode of The Goldnomics Podcast we discuss “The Great Reset” and how it will effect investors and what to do about it. You can listen to the full episode here or by clicking the video below. |
Tags: Daily Market Update,Featured,gold chart,gold price chart,newsletter,silver chart,silver price chart


