Commodities as an Alternative Our readers are presumably following commodity prices. Commodities often provide an alternative to investing in stocks – and they have clearly discernible seasonal characteristics. Thus heating oil tends to be cheaper in the summer than during the heating season in winter, and wheat is typically more expensive before the harvest then thereafter. Precious metals are also subject to seasonal trends. Today I want to put silver under a magnifying glass on your behalf. Its price has lagged the gold price significantly – the gold-silver price ratio currently stands above 80, which is close to historic highs. Are seasonal patterns currently suggesting a positive outlook for silver? Silver:
Topics:
Dimitri Speck considers the following as important: 6) Gold and Austrian Economics, commodities, Featured, newsletter, Precious Metals, silver price
This could be interesting, too:
Nachrichten Ticker - www.finanzen.ch writes Die Performance der Kryptowährungen in KW 9: Das hat sich bei Bitcoin, Ether & Co. getan
Nachrichten Ticker - www.finanzen.ch writes Wer verbirgt sich hinter der Ethereum-Technologie?
Martin Hartmann writes Eine Analyse nach den Lehren von Milton Friedman
Marc Chandler writes March 2025 Monthly
Commodities as an AlternativeOur readers are presumably following commodity prices. Commodities often provide an alternative to investing in stocks – and they have clearly discernible seasonal characteristics. Thus heating oil tends to be cheaper in the summer than during the heating season in winter, and wheat is typically more expensive before the harvest then thereafter. Precious metals are also subject to seasonal trends. Today I want to put silver under a magnifying glass on your behalf. Its price has lagged the gold price significantly – the gold-silver price ratio currently stands above 80, which is close to historic highs. Are seasonal patterns currently suggesting a positive outlook for silver? |
|
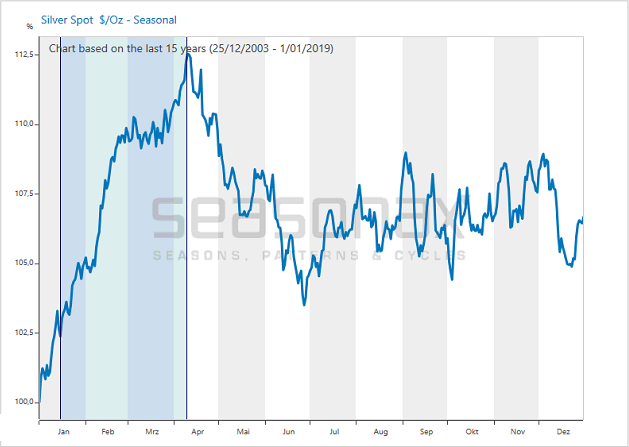
Silver: Shooting Star at the Beginning of the YearThe chart below illustrates the seasonal pattern of the silver price. Contrary to a standard chart, it does not depict prices over a specific time period, but rather the average price pattern of the past 15 years in the form of percentage returns generated in the course of a calendar year. The horizontal axis denotes the time of the year, the vertical axis shows the averaged price information indexed to 100. The seasonal chart makes it possible to discern seasonal patterns at a single glance. As can be seen, there is one phase in silver that really stands out in the course of the year: its price typically rises rapidly at the beginning of the year. By contrast, in the remaining time of the year its price patterns are rather muted from a seasonal perspective. The upcoming seasonal rally phase which lasts until April 09 is highlighted on the chart. |
Silver price in terms of the USD(see more posts on silver price, ) |
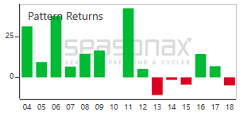
In 11 of 15 Cases the Silver Price Rose Until Early AprilThe seasonally positive time period between January 15 and April 09 brought about a silver rally in 11 of 15 cases. In the 11 winning years the average return in this phase amounted to 16.01 percent, while the average loss in the four losing years was 5.49 percent. An especially large gain of 42.34 percent was posted in 2011. The biggest loss was recorded in 2013; it amounted to a sizable 10.81 percent, which was nevertheless a significantly smaller move. The bar chart below shows the return generated by the silver price during the seasonally positive time period in every year since 2004. Green bars denote years in which gains were achieved, red bars denote years in which a negative return was generated. One can see quite easily that silver is rising more often than falling during this phase, and that the rallies tend to be more pronounced than the declines – the green bars are both more frequent and larger than the red bars. One can also see that losses in this seasonally strong period tended to occur after 2012. This should not be a surprise, as the silver price was in an overarching downtrend in the years since then. |
Silver detail |
What is the Reason for the Spectacular Seasonal Rally Phase in Silver?
Why do silver prices typically rise early in the year, while they are on average rather disappointing over the rest of the year? Silver is primarily an industrial metal. Industrial demand therefore dominates the metal’s seasonal price patterns.
The rise in silver prices early in the year is mainly caused by numerous industrial silver users placing their orders for the metal at the beginning of the new financial year. Such business practices tied to the calendar are not necessarily rational if one wishes to make purchases at the most favorable price. However, it is understandable that this happens, as in business practice annual planning is often shaped by the financial year.
Silver buyers are either not aware of the seasonal price pattern or they are simply ignoring it, as internal business practices take precedence. One fact that may also play a role is that certain inventory positions are supposed to be cleared off the books at the turn of the year. As an aside, seasonal business-related patterns are not unusual – and one quite often comes across them in industries in which one would normally not expect to find them.
What Are the Seasonal Patterns of Gold and Platinum?
Not only silver displays seasonal trends – the same is the case in other precious metals. Investors or traders can easily find out what these trends are. Simply navigate to our web-based app www.app.seasonax.com or call up the Seasonax App in the App Studio of your Bloomberg Professional terminal or in Thomson Reuters Eikon. There you can quickly and easily examine the seasonal patterns of gold, platinum and thousands of other tradable instruments
Yours sincerely,
Dimitri Speck
Founder of Seasonax
PS: the seasonality of silver is particularly spectacular!
Tags: commodities,Featured,newsletter,Precious Metals,silver price


