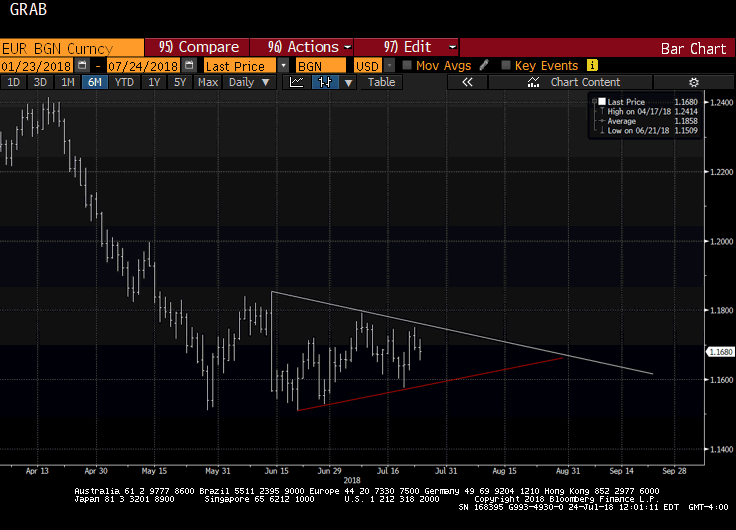
Speculators in the futures market are still net long the euro. They have not been net short since May 2017. In the spot market, the euro approached .15 in late-May and again in mid-June. Last week’s it dipped below .16 for the first time in July and Trump’s criticism of Fed policy saw it recover. Yesterday it reached .1750 before retreating. On the pullback, it held the 61.8% retracement of the recovery (~.1640). Many frustrated dollar bears think the euro is basing and anticipate a breakout to the upside, spurring a recovery that leads to .20 by year-end. The technical case is clear. At .1850, seen in mid-June, the euro already retraced 38.2% of the decline that began in mid-April near .2415. The
Topics:
Marc Chandler considers the following as important: 4) FX Trends, EUR, Featured, Great Graphic, newsletter
This could be interesting, too:
Nachrichten Ticker - www.finanzen.ch writes Die Performance der Kryptowährungen in KW 9: Das hat sich bei Bitcoin, Ether & Co. getan
Nachrichten Ticker - www.finanzen.ch writes Wer verbirgt sich hinter der Ethereum-Technologie?
Martin Hartmann writes Eine Analyse nach den Lehren von Milton Friedman
Marc Chandler writes March 2025 Monthly
| Speculators in the futures market are still net long the euro. They have not been net short since May 2017. In the spot market, the euro approached $1.15 in late-May and again in mid-June. Last week’s it dipped below $1.16 for the first time in July and Trump’s criticism of Fed policy saw it recover. Yesterday it reached $1.1750 before retreating. On the pullback, it held the 61.8% retracement of the recovery (~$1.1640).
Many frustrated dollar bears think the euro is basing and anticipate a breakout to the upside, spurring a recovery that leads to $1.20 by year-end. The technical case is clear. At $1.1850, seen in mid-June, the euro already retraced 38.2% of the decline that began in mid-April near $1.2415. The 50% retracement is near $1.1960, and the 61.8% retracement is by $1.2070. The technical indicators, such as the Slow Stochastics and MACDs on the weekly charts are supportive. While this is possible, we see the technical position a bit differently. The Great Graphic shows how the euro has been tracing a triangle or wedge pattern after the April-May leg down. It is most often a continuation pattern. A break to the downside would give measuring objective near $1.12. However, it remains a few weeks from the apex, and this is consistent with continued range-bound activity. Regardless of one’s views, a break from the triangle pattern will likely be among the first indications of a new trend. Tomorrow, the top of the pattern is near $1.1750, and the bottom is found around $1.1580. At the end of the month, in one week’s time, the boundaries are $1.1600 and $1.1735. |
EUR/BGN, daily |
Tags: $EUR,Featured,Great Graphic,newsletter

