Federal Reserve – still managing to maintain enough confidence Photo credit: Adam Fagen / Flickr Confidence Not Lost Yet The price of gold moved down about sixteen bucks, while that of silver dropped about three dimes. In other words, the dollar gained 0.3 milligrams of gold and 0.04 grams of silver. We continue to read stories of the “loss of confidence in central banks.” We may not know the last detail of what that will look like—when it occurs one day. However, we will wager an ounce of fine gold against a soggy dollar bill that it will not look like today with the market bidding dollars higher. Loss of confidence is just a meme used by gold bettors. What are they using to make their bets? Dollars. What are they trying to win? More of the dollars they say will soon go bidless. *Achem* One benefit to looking at the supply and demand fundamentals is that it tells us, more accurately than price action, what confidence in the central banks is really doing. So let’s take a look at that picture. Fundamental Developments Gold and silver prices First, here’s the graph of the metals’ prices. Gold and silver prices – click to enlarge. Gold-Silver Price Ratio Next, this is a graph of the gold price measured in silver, otherwise known as the gold to silver ratio. The ratio was up this week. Gold-silver ratio – click to enlarge.
Topics:
Keith Weiner considers the following as important: dollar price, Featured, Federal Reserve, Gold and its price, gold basis, Gold co-basis, gold price, newsletter, Precious Metals, silver basis, Silver co-basis, silver price, Silver Price Ratio
This could be interesting, too:
Nachrichten Ticker - www.finanzen.ch writes Die Performance der Kryptowährungen in KW 9: Das hat sich bei Bitcoin, Ether & Co. getan
Nachrichten Ticker - www.finanzen.ch writes Wer verbirgt sich hinter der Ethereum-Technologie?
Martin Hartmann writes Eine Analyse nach den Lehren von Milton Friedman
Marc Chandler writes March 2025 Monthly
Confidence Not Lost Yet
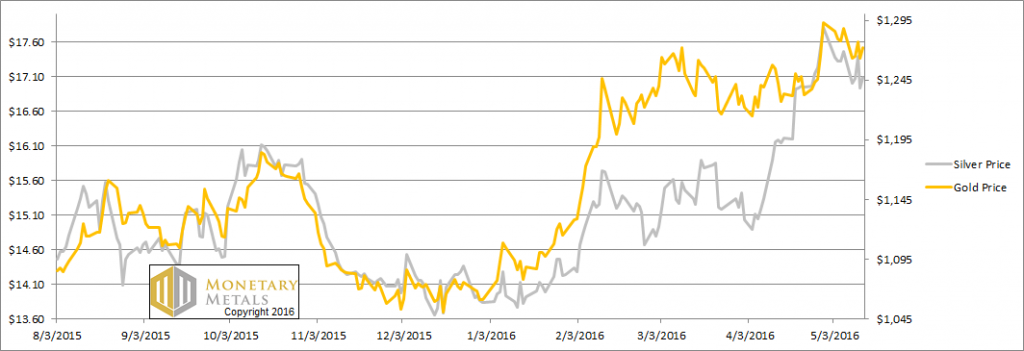
The price of gold moved down about sixteen bucks, while that of silver dropped about three dimes. In other words, the dollar gained 0.3 milligrams of gold and 0.04 grams of silver.
We continue to read stories of the “loss of confidence in central banks.” We may not know the last detail of what that will look like—when it occurs one day.
However, we will wager an ounce of fine gold against a soggy dollar bill that it will not look like today with the market bidding dollars higher.
Loss of confidence is just a meme used by gold bettors. What are they using to make their bets? Dollars. What are they trying to win? More of the dollars they say will soon go bidless.
*Achem*
One benefit to looking at the supply and demand fundamentals is that it tells us, more accurately than price action, what confidence in the central banks is really doing. So let’s take a look at that picture.
Fundamental Developments
Gold and silver pricesFirst, here’s the graph of the metals’ prices. |
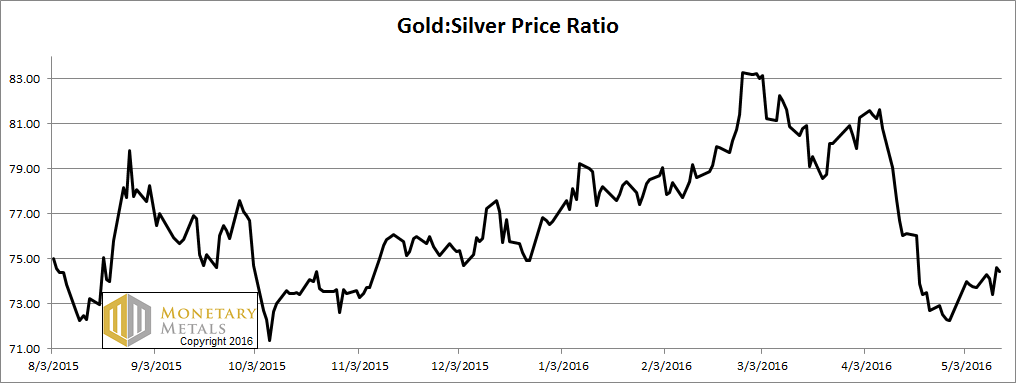
Gold-Silver Price RatioNext, this is a graph of the gold price measured in silver, otherwise known as the gold to silver ratio. The ratio was up this week. |
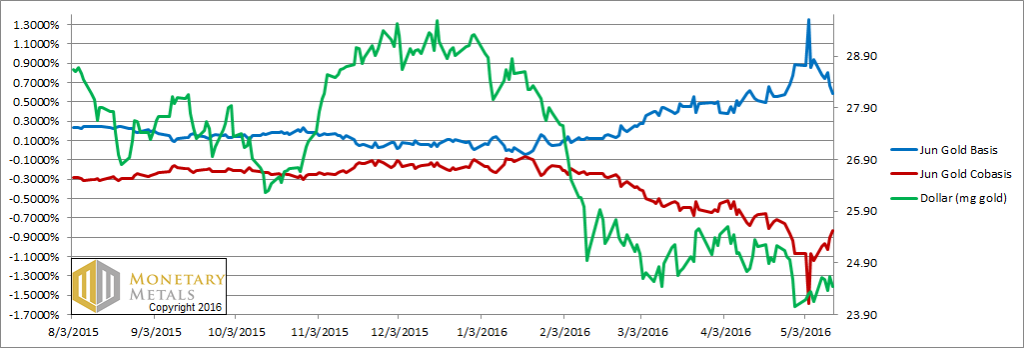
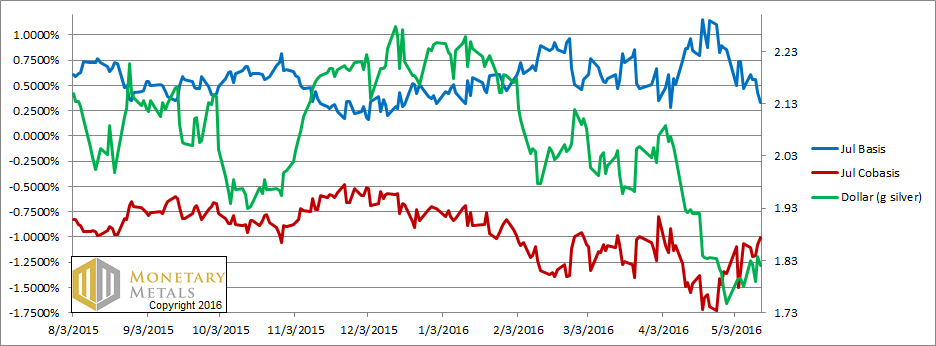
For each metal, we will look at a graph of the basis and co-basis overlaid with the price of the dollar in terms of the respective metal. It will make it easier to provide brief commentary. The dollar will be represented in green, the basis in blue and co-basis in red.
Here is the gold graph.
Gold basis and co-basis and the dollar price. |
The price of the dollar is up (i.e. the price of gold, measured in dollars, is down) and the scarcity of gold (i.e. the co-basis, the red line) is up with it. This is our old pattern. When scarcity follows the dollar price, then it is just speculators adjusting their positions.
Back to confidence in central banks. We can say two things. One, the fundamental price of gold is down (remember, this is the expiring June contract that is under heavy selling pressure, due to the contract roll, and hence will have a depressed basis and — in more “normal” post-2008 markets, a positive co-basis). It is down twenty bucks, about $40 below the current market price.
Two, confidence in central banks is still humming along just fine. Speculators are betting on gold futures to get more of those allegedly despised Federal Reserve Notes.
When the actual repudiation of central bank paper occurs, no one will want the stuff. Gold owners will no longer think of the value of their gold in dollar terms. Just as the people of Venezuela do not think of the value of their gold in terms of the collapsing bolivar.
Now let’s turn to silver.
Silver basis and co-basis and the dollar price. |
In silver, it’s the same pattern as in gold.
Our calculated fundamental price of silver dropped almost a buck. It’s now nearly two bucks below the market price.
In silver, even more than in gold, many speculators who do not question the validity of the dollar also do not question that silver is going up, and hence a great way to make some more dollars.
We now calculate that the fundamental level of the gold-silver ratio is over 81.
Charts yby: Monetary Metals
Previous post
