George Dorgan
My articles My siteAbout meMy booksMy videos
Follow on:TwitterFacebookGoogle +
CFA SocietySeeking Alpha
Swiss Franc Currency Index Our weekly comparison with the dollar index: The positive performance of the Swiss franc index was reversed on Friday. Finally the dollar index had a better week than the Swiss Franc index. Click to enlarge. Swiss Franc Currency Index (3 years) The Swiss Franc index is the trade-weighted currency performance (see the currency basket) On a three years interval, the Swiss Franc had a weak performance. The dollar index was far stronger. The dollar makes up 40% of the SNB portfolio and of Swiss exports. Contrary to popular believe, the CHF index gained only 1.73% in 2015. It lost 9.52% in 2014., when the dollar (and yuan) strongly improved. Click to enlarge. EUR/CHF The Euro-Swiss continues its slow uptrend that we see since the U.K. Referendum. Weak Swiss Retail Sales data FX Rates August 1 to August 5, 2016 Click to enlarge. US Dollar The US Dollar Index stalled in front of a band of resistance (96.45-96.55), which houses the 61.8% retracement of the decline from July 27 (97.55) and the 20-day moving average. The technical indicators look constructive as the Dollar Index has strung together a three-day advance. An advance through the band could signal a move back toward the recent highs. Initial support is now seen just below 96.00.
Topics:
George Dorgan considers the following as important: Crude Oil, EUR/CHF, EUR/USD, Featured, FX Trends, MACDs, newsletter, Swiss Franc Index, U.S. Treasuries, US Dollar Index, USD/CAD, USD/CHF
This could be interesting, too:
Nachrichten Ticker - www.finanzen.ch writes Die Performance der Kryptowährungen in KW 9: Das hat sich bei Bitcoin, Ether & Co. getan
Nachrichten Ticker - www.finanzen.ch writes Wer verbirgt sich hinter der Ethereum-Technologie?
Martin Hartmann writes Eine Analyse nach den Lehren von Milton Friedman
Marc Chandler writes March 2025 Monthly
Swiss Franc Currency IndexOur weekly comparison with the dollar index: The positive performance of the Swiss franc index was reversed on Friday. Finally the dollar index had a better week than the Swiss Franc index. |
 Click to enlarge. |
Swiss Franc Currency Index (3 years)The Swiss Franc index is the trade-weighted currency performance (see the currency basket) On a three years interval, the Swiss Franc had a weak performance. The dollar index was far stronger. The dollar makes up 40% of the SNB portfolio and of Swiss exports. Contrary to popular believe, the CHF index gained only 1.73% in 2015. It lost 9.52% in 2014., when the dollar (and yuan) strongly improved. |
 Click to enlarge. |
EUR/CHFThe Euro-Swiss continues its slow uptrend that we see since the U.K. Referendum. Weak Swiss Retail Sales data |
FX Rates August 1 to August 5, 2016 Click to enlarge. |
US DollarThe US Dollar Index stalled in front of a band of resistance (96.45-96.55), which houses the 61.8% retracement of the decline from July 27 (97.55) and the 20-day moving average. The technical indicators look constructive as the Dollar Index has strung together a three-day advance. An advance through the band could signal a move back toward the recent highs. Initial support is now seen just below 96.00. |
FX Rates August 1 to August 5, 2016 Click to enlarge. |
EUR/USDThe euro posted an outside up day on July 27. It is signaled about a two cent move. The euro staged an outside down day on August 5, with the help of the stronger US employment data.
It is difficult to envision a two cent decline from the $1.1045 area the euro found support ahead of the weekend.
Indeed, the losses after the employment data may have completed a correction that began a few days earlier. On an intraday basis, the euro had surpassed the 61.8% retracement (~$1.1060) of the rally advance began on July 25 near $1.0950, but it closed above it. The first test of this near-term constructive view is in the $1.1100-$1.1130 area.
|
 Click to enlarge. |
USD/JPYOver the past four sessions, the dollar has carved out a shelf in the JPY100.65-JPY100.85. More work is need to boost investors confidence that yen’s strength is exhausted. Initial resistance is seen in the JPY102.25 area, and JPY102.85 is the highest the dollar has been since the BOJ disappointed. The 38.2% retracement of the decline from the July 21 high near JPY107.50 is JPY103.30. The RSI and fast stochastics |
 Click to enlarge. |
GBP/USD
The combination of the multidimensional easing measures by the Bank of England, which got ahead of market expectations, coupled with the second consecutive robust US jobs
report, knocked sterling back from two-and-a-half-week highs to the lower end of its range. Sterling approached $1.3020. Although sterling was pounded through there in early-July, it has held above there since. While we expect an eventual break, the technical indicators do not suggest it is imminent.
|
 Click to enlarge. |
AUD/USDThe Australian dollar was still one of the strongest currencies against the dollar last week (~0.25%). Although the Reserve Bank of Australia cut interest rates, the combination still relatively high yields and triple-A credit draws international savings and speculative interest.
Even in the face of the rising US dollar on the employment data, the Australian dollar held up well. The technical indicators we use are not generated strong signals.
The Aussie is approaching a band of resistance found between around $0.7660 to $0.7680.
In addition, it is flirting with trendline resistance. It is found by connecting the April 21 high (~$0.7830) and the July 15 high (~$0.7675). It caught a couple more recent highs and was found near $0.7635 before the weekend. The trend line was violated intraday, but not on a closing basis.
It is found just above $0.7620 at the end of next week.
|
 Click to enlarge. |
USD/CADThe US dollar has built a based near CAD1.30 for six sessions. It took the extremely poor Canadian data (and strong US data) to lift it from its base to CAD1.32. The economy lost jobs for the second consecutive month in July. Canada also reported its second consecutive record trade deficit June).
This follows, as you will recall, a 0.6% contraction in the Canadian economy in the month of May. It is the third decline in output in four months.
We continue to look for test near CAD1.33. Over the slightly
longer term, the risk increases that Bank of Canada will be more dovish, and the US dollar moves toward CAD1.36. |
 Click to enlarge. |
Crude OilOil prices had a midweek bounce that saw the September light sweet crude oil futures contract rally six percent in two sessions. The proximate trigger was a sharp, that is 10-fold larger The rising dollar ahead of the weekend put a damper on oil. Technical indicators such the MACDs and slow stochastics suggest a more sustained correction is likely nearby if it has not yet begun. Talk now that some of in OPEC are talking about an agreement, perhaps on quotas as early as next month may feed such price action. We are skeptical. The usual proponents, like Venezuela and Ecuador, are the antagonists. The Iranians are only about half way toward returning to output levels seen before the embargo.
Agreeing to an output cap before returning output to status quo ante raises the cost of surrendering (or postponing) their nuclear ambitions.
The September light sweet contract met and overshot the 61.8% of this year’s $20 rally (from a little below $33 to a almost $53), but finished the week above it (~$40.45). Initial resistance is seen $42.40-$42.80, with a break allowing for $44.00-40
|
 Click to enlarge. Source Bloomberg.com |
US TreasuriesUS 10-year yields have not been much above 1.60% since the UK referendum. The rise in yields after the jobs data put them back to the upper end of the range. The September bond futures found support near 132-00 before the weekend. However, a move below last month’s low (131-19) which corresponds to the 50% retracement of the rally (decline in yields) since the end of May, is needed to boost confidence that a top of some import is in place. Recall that 130-21 was the low from the UK referendum. |
 Click to enlarge. Source Bloomberg.com |
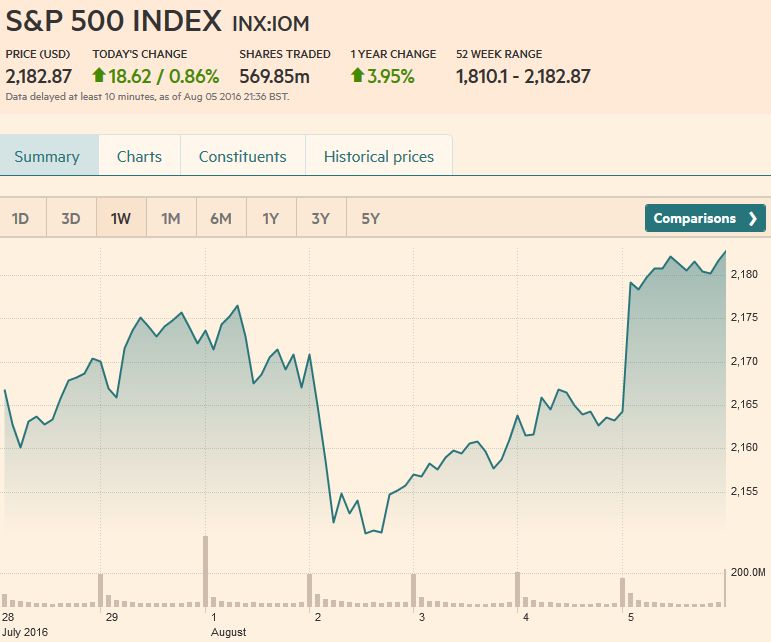
S&P 500The S&P 500 eased on profit-taking at the start of the week. The pullback saw the S&P 500 slip below its 20-day moving average for the first time in a month. Buying, perhaps encouraged by first, lower interest rates, as the Australia cut rates and the UK rejoined the QE club, and then by the economic strength implied by the jobs data, lifted the index to new record highs before the weekend. The pre-weekend gain of about 0.75% was the largest since the June employment data was reported in early July. The S&P 500 recorded a bullish outside up week. |
 Click to enlarge. |
Charts and CHF data added by George Dorgan and the snbchf team, Text Posted by Marc Chandler on Marc to Markets,