Imagine the financial crisis knocked you out and you did not wake up from the coma that followed until this day. Then, presented with the following three charts you were asked to guess where the federal funds rate was trading. Given the fact that the core CPI is on a steep uptrend and currently over the arbitrarily set 2 per cent target; unemployment below what the FOMC regards as full employment and; GDP running at a rate far above the Federal Reserve’s own estimates of so-called potential; We are certain most people would say the Federal Reserve, still very much data dependent (yes, that is what they claim), would be responsible enough to have lifted the rate far above its long term average to maintain positive real rates in order to cool down the economy. This is what modern Keynesianism- and Monetarism teaches the zealous acolytes populating the world central banks after all. In short, you would say the Federal Funds rate would be in the vicinity of five per cent. Key Fed Indicators: Core CPI, Unemployment, Real GDP vs.
Topics:
Eugen von Böhm Bawerk considers the following as important: Austrian economics, Bawerk, Central Banks, Featured, newsletter, Price Inflation, US
This could be interesting, too:
Nachrichten Ticker - www.finanzen.ch writes Die Performance der Kryptowährungen in KW 9: Das hat sich bei Bitcoin, Ether & Co. getan
Nachrichten Ticker - www.finanzen.ch writes Wer verbirgt sich hinter der Ethereum-Technologie?
Martin Hartmann writes Eine Analyse nach den Lehren von Milton Friedman
Marc Chandler writes March 2025 Monthly
Imagine the financial crisis knocked you out and you did not wake up from the coma that followed until this day. Then, presented with the following three charts you were asked to guess where the federal funds rate was trading. Given the fact that
- the core CPI is on a steep uptrend and currently over the arbitrarily set 2 per cent target;
- unemployment below what the FOMC regards as full employment and;
- GDP running at a rate far above the Federal Reserve’s own estimates of so-called potential;
|
We are certain most people would say the Federal Reserve, still very much data dependent (yes, that is what they claim), would be responsible enough to have lifted the rate far above its long term average to maintain positive real rates in order to cool down the economy. This is what modern Keynesianism- and Monetarism teaches the zealous acolytes populating the world central banks after all. In short, you would say the Federal Funds rate would be in the vicinity of five per cent. |
Key Fed Indicators: Core CPI, Unemployment, Real GDP vs. Potential GDP click to enlarge |
Fed Funds versus Taylor Rule EstimatesBeing told the Federal Funds rate is close to the zero lower bound (which turned out to be no bound after all) you may enquire as to whether the Federal Reserve had just slashed rates to fend off an imminent recession. Presented with the next chart whereby the abovementioned information is translated into a simple central bank rule, as proposed by John Taylor in the 1990s, you would probably be frightened back into a coma again. |
 click to enlarge |
The Housing Bubble IndicatorWhile the large red area prior to the housing bubble bust helped form a global crisis on a scale the world hadn’t seen since the 1930s, the current level of monetary folly completely dwarfs even the Maestro`s insanity. The amount of capital consumption and misallocation today must be absolutely unprecedented and it logically follows that the inevitable bust that currently brews under the fragile complacency in financial market is of equal proportions. For every action follows an equal and opposite reaction; nowhere is this truer than in monetary policy. The red area comprising the difference between the Taylor rule and the actual Fed Funds rate (not to mention the area between the Taylor rule and the shadow rate that tries to mimic the effect of forward guidance and QE) has never ever been larger than during this bubble. We added Greenspan’s and Yellen’s own rules, and even by their standard rates should be far higher by now. As a side-note, we define a bubble as an economic activity that is not self-sustaining and by extension capital consuming. The Fed has painted themselves so far into a corner that they cannot avoid stepping on some wet paint soon. A symbolic 25 basis point hike in December and financial Armageddon seemed to follow. Commodity prices crashed as global dollar funding dried up. Capital outflow from emerging markets became an acute problem. That is why, despite all the data dependence, the Fed is unable to follow through on their incessant threats to raise rates. The house of card built on continuation of ample dollar flows at low rates is too fragile to withstand even the slightest disruption; such as an insignificant 25 basis points. |
 click to enlarge While our definition of a bubble is more robust than those that focus solely on financial valuation metrics, there is obviously a high degree of causal connection between the two. Consider the chart below depicting household net worth as share of their disposable income; over time, this ratio should be mean reverting. Household asset are what produces the output ultimately used to pay back households their income; since valuation should, in theory at least, be the discounted stream of future cash flows then it follows that the ratio between the two revert back to its long term mean. If the value of household assets moves too far away from underlying fundamentals, the carrying cash flow cannot support the price paid for it and a bubble has formed. A bubble that will eventually deflate. We use the mean from 1952 (start of data series) to 1987 (when Greenspan took over at the Fed) as our benchmark. Whenever valuations strayed too far away (defined as two standard deviations) it moved back down to its mean. Likewise for under-valuations as happened in the mid-1970s. However, as Greenspan floored the monetary pedal from 1987, valuations seem to have reached what looks like a permanently high plateau. Neither the dot-com nor the housing bubble were allowed to correct itself, as it should, due to monetary interventions. That said, even with monetary interventions they never managed to sustain elevated levels at 6 to 6.5 times income for very long. With the madness presented above, it should come as no surprise that we are once again at these extreme levels and that from here relative valuation has nowhere to go but down. |
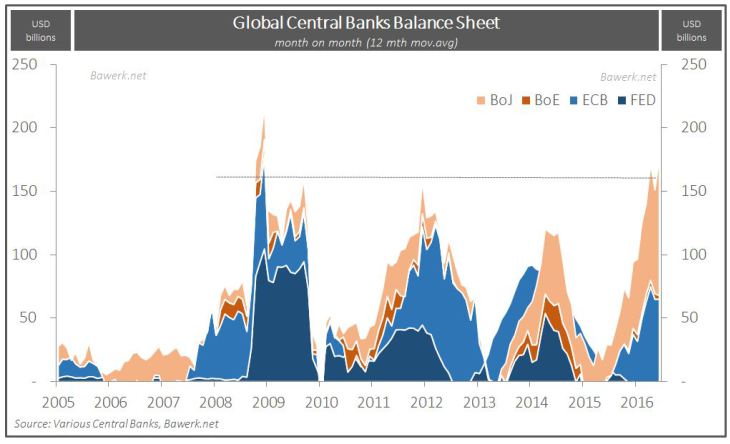
Fed will never hike more than 50 bipsEven worse, hiking the dollar rate when global central banks, like the ECB and BoJ are moving full throttle forward with their QE programs makes the situation even more precarious for the Federal Reserve. Stunning as it may be, but global QE, in USD term, is currently running at a record rate with monthly liquidity expansions of USD150 – 180bn (h/t ZeroHedge). We said last year that the FOMC would never dare do more than 25 to 50 basis points and we still stick with that call. Despite the “overheating economy” in a Keynesian sense, the underlying fundamentals are getting weaker by the day and the financial system is destined to crash. One day the FOMC will run out of excuses and hike, setting in motion the proverbial butterfly that rocks the world. |
 click to enlarge |