Summary:
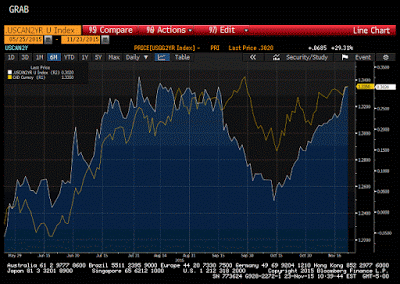
The Canadian dollar is more than a petro currency. It is also subject to the same forces of divergence that have lifted the US dollar more broadly. Since the beginning of the year, the US two-year yield has risen 26 bp while Canada's two-year yield has fallen almost 39 bp. This Great Graphic, created on Bloomberg shows two time series. The yellow line is the US dollar against the Canadian dollar. The white line is the two-year yield spread. Earlier today the US dollar tested the multi-year high set in late-September just below CAD1.3460. Today's high (according to Bloomberg) was about CAD1.3435. The two-year yield spread reached a little more than 32.5 bp. The multi-year high set in early August was a tenth of a basis point higher. Consider what has happened since the middle of October, when the recent moves began. The US dollar traded a little below CAD1.2835. It rallied six big figures in a little less than six weeks. The two-year differential fell to a low below 3 bp on October 15. It has risen 29 bp over the same period. Oil prices also fell during this period. Note that the January 16 light sweet futures contract put in the recent high near a barrel on October 10. By October 15 it reached a low of almost .60. It traded almost .40 today. The argument here is not that the price of oil does not impact the Canadian dollar.
Topics:
Marc Chandler considers the following as important: Currency Positioning Technical Outlook, Great Graphic
This could be interesting, too:
Marc Chandler writes Great Graphic: Views Distill to Short Sterling Long Yen Opportunity
Marc Chandler writes Great Graphic: Euro’s (OECD) PPP
Marc Chandler writes Great Graphic: The Dollar Index Climbs a Wall of Worry
Marc Chandler writes Great Graphic: Weekly Jobless Claims and the S&P 500
The Canadian dollar is more than a petro currency. It is also subject to the same forces of divergence that have lifted the US dollar more broadly. Since the beginning of the year, the US two-year yield has risen 26 bp while Canada's two-year yield has fallen almost 39 bp.
This Great Graphic, created on Bloomberg shows two time series. The yellow line is the US dollar against the Canadian dollar. The white line is the two-year yield spread.
Earlier today the US dollar tested the multi-year high set in late-September just below CAD1.3460. Today's high (according to Bloomberg) was about CAD1.3435. The two-year yield spread reached a little more than 32.5 bp. The multi-year high set in early August was a tenth of a basis point higher.
Consider what has happened since the middle of October, when the recent moves began. The US dollar traded a little below CAD1.2835. It rallied six big figures in a little less than six weeks. The two-year differential fell to a low below 3 bp on October 15. It has risen 29 bp over the same period.
Oil prices also fell during this period. Note that the January 16 light sweet futures contract put in the recent high near $52 a barrel on October 10. By October 15 it reached a low of almost $46.60. It traded almost $40.40 today.
The argument here is not that the price of oil does not impact the Canadian dollar. It is that the flow of capital is larger than the flow of oil and that the Canadian dollar is subject to the same divergence force that is lifted the US dollar against most currencies.

