Summary:
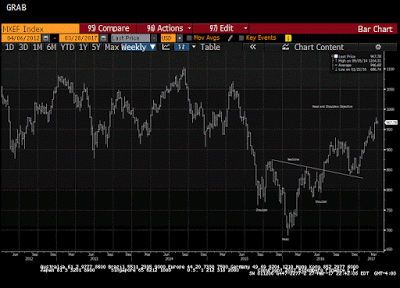
Summary: MSCI Emerging Market Index is up 12.25% here in Q1. The index is approaching long-standing technical objectives. Look for profit-taking ahead of quarter-end as fund managers rebalance. This Great Graphic from Bloomberg is a weekly bar chart of MSCI Emerging Market equity index. In H2 15 and H1 16, it carved out a head and shoulders bottom that we identify on the chart. We also drew in the neckline and noted the minimum objective of the inverse head and shoulders pattern. The index has risen 12.25% in Q1 17 to approach the objective. Technical indicators also suggest scope for a correction. The Slow Stochastics have turned down. The MACDs are about to cross lower. A break of 960 would be the first preliminary indication that the impressive rally in Q1 is over and the index has approached levels which are potential turning points. An advance through 971 would suggest that it is premature to pick a top, but we would be attentive to near-term reversals, and like the higher levels as an opportunity to lighten positions.
Topics:
Marc Chandler considers the following as important: emerging markets, equities, Featured, FX Trends, Great Graphic, newsletter
This could be interesting, too:
Nachrichten Ticker - www.finanzen.ch writes Die Performance der Kryptowährungen in KW 9: Das hat sich bei Bitcoin, Ether & Co. getan
Nachrichten Ticker - www.finanzen.ch writes Wer verbirgt sich hinter der Ethereum-Technologie?
Martin Hartmann writes Eine Analyse nach den Lehren von Milton Friedman
Marc Chandler writes March 2025 Monthly
Summary:
MSCI Emerging Market Index is up 12.25% here in Q1.
The index is approaching long-standing technical objectives.
Look for profit-taking ahead of quarter-end as fund managers rebalance.
|
This Great Graphic from Bloomberg is a weekly bar chart of MSCI Emerging Market equity index. In H2 15 and H1 16, it carved out a head and shoulders bottom that we identify on the chart. We also drew in the neckline and noted the minimum objective of the inverse head and shoulders pattern.
The index has risen 12.25% in Q1 17 to approach the objective. Technical indicators also suggest scope for a correction. The Slow Stochastics have turned down. The MACDs are about to cross lower.
A break of 960 would be the first preliminary indication that the impressive rally in Q1 is over and the index has approached levels which are potential turning points. An advance through 971 would suggest that it is premature to pick a top, but we would be attentive to near-term reversals, and like the higher levels as an opportunity to lighten positions.
|
MXEF Index |
Tags: Emerging Markets,equities,Featured,Great Graphic,newsletter

