Today we are taking our weekly look at the charts for gold and silver. Republicans and Democrats continue to play the “will they, won’t they?” game over another stimulus package in a Covid19 ravaged US economy. An agreement on a package will ultimately be seen as positive for the markets but, with the US Election just weeks away this may prove to prolong negotiations or postpone decisions until the results of the election are clear and accepted by all. Will Gold Now Retest ,930? As you can see from the gold chart below, gold has rallied on positive stimulus news and pulled back as negotiations stall. After the previous “false break” above ,910, gold once again closed above this level which opens up a retest of ,930. However, the short-term upward trend line
Topics:
Mark O'Byrne considers the following as important: 6a.) GoldCore, 6a) Gold & Bitcoin, Daily Market Update, Featured, gold chart, gold price chart, newsletter, silver chart, silver price chart
This could be interesting, too:
Nachrichten Ticker - www.finanzen.ch writes Die Performance der Kryptowährungen in KW 9: Das hat sich bei Bitcoin, Ether & Co. getan
Nachrichten Ticker - www.finanzen.ch writes Wer verbirgt sich hinter der Ethereum-Technologie?
Martin Hartmann writes Eine Analyse nach den Lehren von Milton Friedman
Marc Chandler writes March 2025 Monthly
Today we are taking our weekly look at the charts for gold and silver.
Republicans and Democrats continue to play the “will they, won’t they?” game over another stimulus package in a Covid19 ravaged US economy. An agreement on a package will ultimately be seen as positive for the markets but, with the US Election just weeks away this may prove to prolong negotiations or postpone decisions until the results of the election are clear and accepted by all.
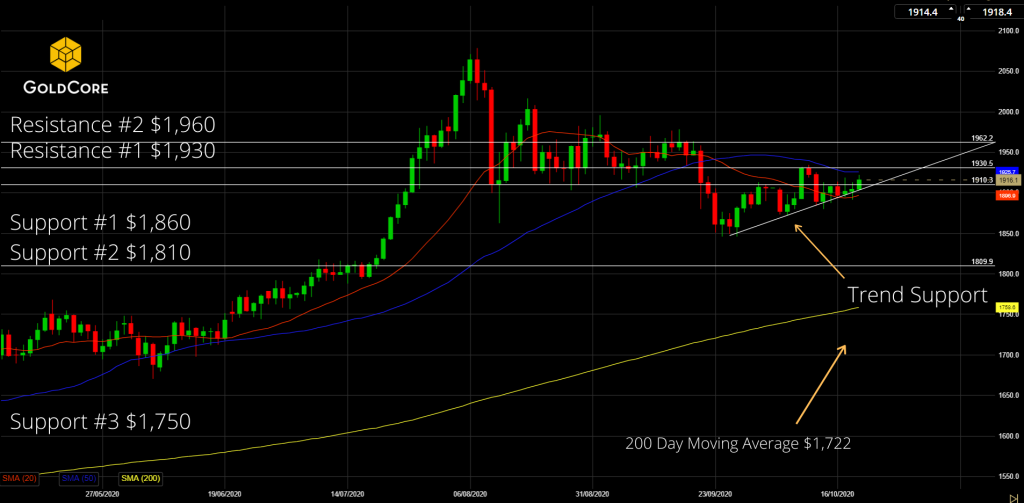
Will Gold Now Retest $1,930?As you can see from the gold chart below, gold has rallied on positive stimulus news and pulled back as negotiations stall. After the previous “false break” above $1,910, gold once again closed above this level which opens up a retest of $1,930. However, the short-term upward trend line is providing support but is also helping to form what most chartists recognise as a bearish pattern. A break of this support trend line opens up a retest of the $1,860 level and a break of that level would be short-term bearish for gold as there is not much in the way of support until $1,810. |
Gold Price Chart |
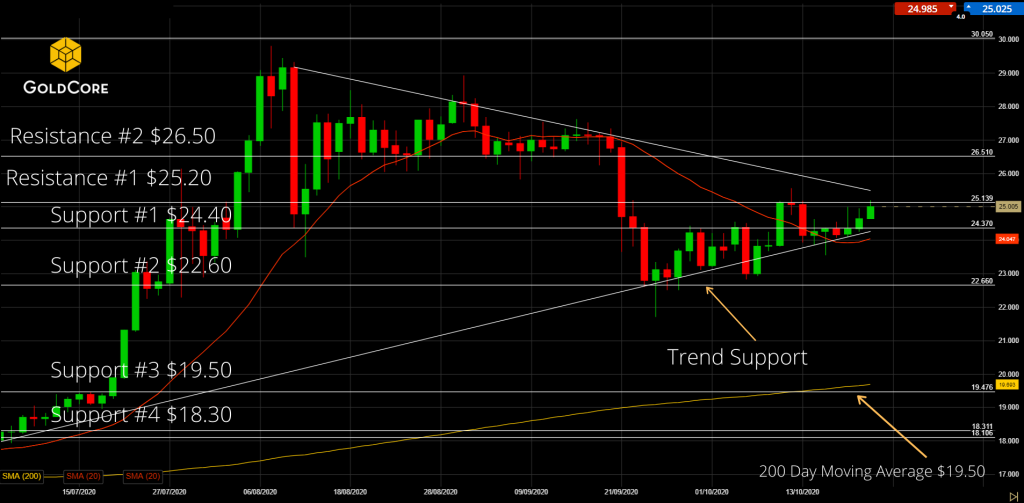
Silver Remains Vulnerable to a Negative News CycleA similar pattern is emerging for silver as it retest $25.20. A close above this level could be short-term bullish for silver and see a quick move up to test the $26.50 level again. With this bearish pattern being formed with the upward sloping trend support line, silver remains vulnerable to a negative news cycle. A break lower opens up a retracement to the support level at $22.60. As we have noted before if we break this level there is not much support on the charts until near the 200 Day Moving Average at $19.50. Clarity on the US Stimulus package will help signal the next move in the precious metals markets. However, this now may not happen until we get clarity on the result of the US election. When the cork is popped we expect this to be very bullish for both gold and silver. Now might be a great opportunity to position your portfolio to take advantage of the upcoming moves. |
Silver Price Chart |
Tags: Daily Market Update,Featured,gold chart,gold price chart,newsletter,silver chart,silver price chart


