Swiss Economicblogs.org
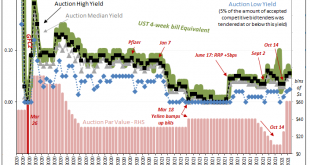
Treasury Secretary Janet Yellen hasn’t just been busy hawking cash management bills, her department has also been filling back up with the usual stuff, too. Regular T-bills. Going back to October 14, at the same time the CMB’s have been revived, so, too, have the 4-week and 13-week (3-month). Not the 8-week, though. Of the first, it’s been a real tsunami at this tenor, too. Up to early August, Treasury had regularly (weekly) sold $40 billion in one-month paper. From...
Read More »Bill Issuance Has Absolutely Surged, So Why *Haven’t* Yields, Reflation, And Other Good Things?