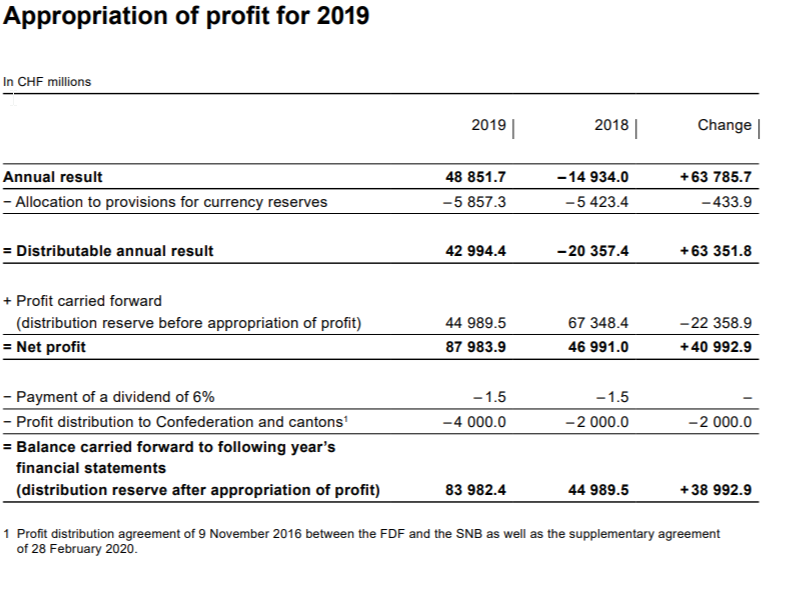
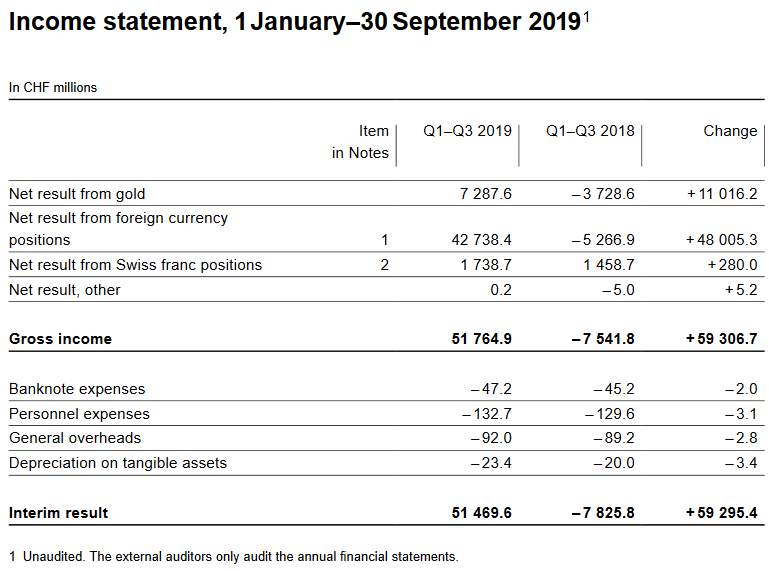
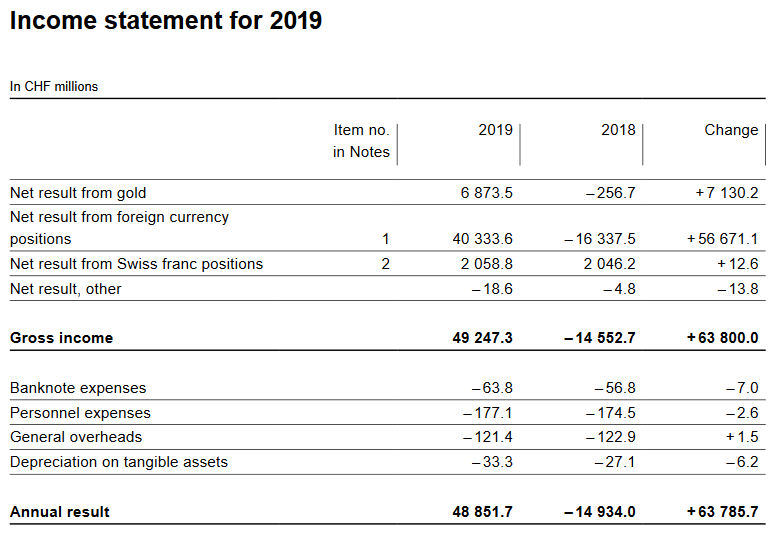
The increasing volatility of SNB Earnings Annual results are not really definite. Given that the SNB accumulates foreign currencies with interventions, they have huge swings. But the SNB may lose 50 billion in one year and win 60 billion in the next year or vice verse. Franc will rise again with crisis or inflation With a new financial crisis or a with a big rise of inflation, the run into the Swiss franc will start again. Deflationary period (e.g. Corona Crisis) During deflationary periods and recessions, the SNB will strongly intervene, similarly as she did in 2008/2009. During the Corona Crisis, the SNB intervened at 1.05 – 1.06 for a euro, in 2009 even for 1.50 These high intervention levels pave the way for later losses, which are the inflationary periods.
Topics:
George Dorgan considers the following as important: 1.) SNB Press Releases, 1) SNB and CHF, Featured, newsletter, SNB balance sheet, SNB equity holdings, SNB Gold Holdings, SNB profit, SNB results, SNB sight deposits, Swiss National Bank
This could be interesting, too:
Nachrichten Ticker - www.finanzen.ch writes Die Performance der Kryptowährungen in KW 9: Das hat sich bei Bitcoin, Ether & Co. getan
Nachrichten Ticker - www.finanzen.ch writes Wer verbirgt sich hinter der Ethereum-Technologie?
Martin Hartmann writes Eine Analyse nach den Lehren von Milton Friedman
Marc Chandler writes March 2025 Monthly
The increasing volatility of SNB EarningsAnnual results are not really definite. Given that the SNB accumulates foreign currencies with interventions, they have huge swings. But the SNB may lose 50 billion in one year and win 60 billion in the next year or vice verse. Franc will rise again with crisis or inflationWith a new financial crisis or a with a big rise of inflation, the run into the Swiss franc will start again. Deflationary period (e.g. Corona Crisis)During deflationary periods and recessions, the SNB will strongly intervene, similarly as she did in 2008/2009. During the Corona Crisis, the SNB intervened at 1.05 – 1.06 for a euro, in 2009 even for 1.50 These high intervention levels pave the way for later losses, which are the inflationary periods.
|
|
Inflationary periodsDuring an inflationary period the
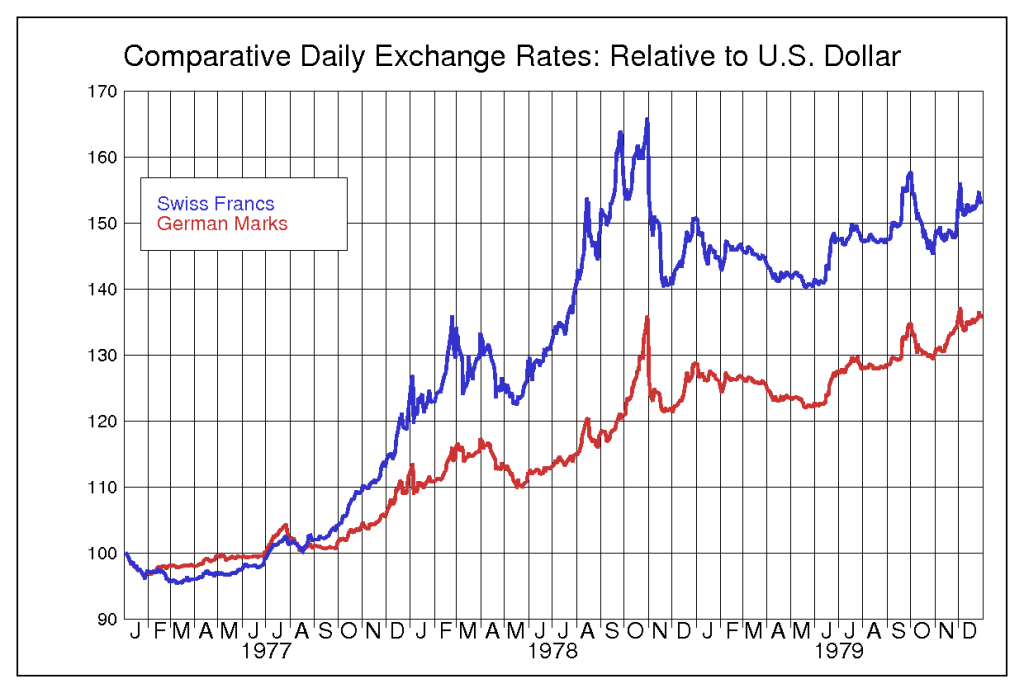
And this will lead to a massive SNB of at least 150 billion CHF. This is not a black swan, but a normal inflation scenario. We have seen a 60% rise of CHF in the 1970s; this was a black swan. In this case all assets except gold will fall. However, SNB’s gold share of 6% is too small to cushion this scenario. Some additional technical details: The crux, however, is
|
 |
Some extracts from the official statement with annotations.
|
Income Statement for Q1 2020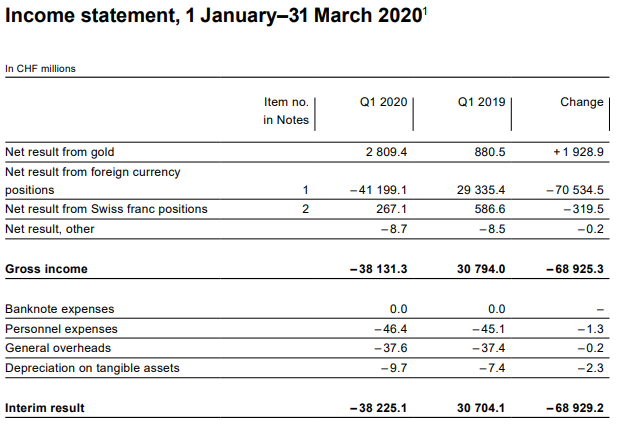 Source: snb.ch - Click to enlarge |
||||||||||||||||||||||||||||||||||||||||||||||||||||||
SNB Asset Allocation and Expected ReturnMain insights:
A roughly calculated expected return should be around 2% as of Q1/2020.
This should be re-compensate for the on average 2% yearly increase of the Swiss franc. |
SNB Asset Allocation per 31.3.2020 (compared with Q4 2019)
|
||||||||||||||||||||||||||||||||||||||||||||||||||||||
Loss on foreign currency positionsWe see the typical consequence of a recession
The following numbers are in billion Swiss Francs.
|
SNB Loss on Foreign Currencies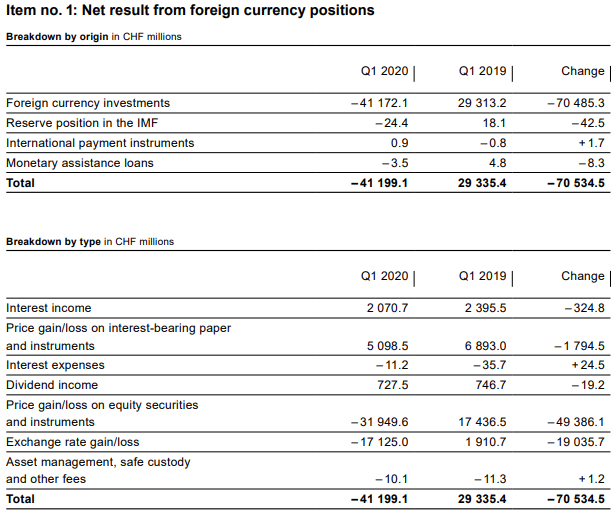 Source: snb.ch - Click to enlarge |
||||||||||||||||||||||||||||||||||||||||||||||||||||||
Valuation gain on gold holdingsA valuation gain of CHF 2.8 billion was recorded on gold holdings, which remained unchanged in volume terms. Gold was trading at CHF 49,923 per kilogram at the end of March 2020 (end 2019: CHF 47,222).
Percentage of gold to balance sheetThe percentage of gold has risen to 6.09% thanks to these rising prices.
Balance Sheet compared to GDP
|
SNB Balance Sheet for Gold Holdings for Q1 2020 Source: snb.ch - Click to enlarge |
||||||||||||||||||||||||||||||||||||||||||||||||||||||
Profit on Swiss franc positionsThe SNB maintains its profitability, last but not least, thanks to the reduction of the profitability of banks. When too many funds arrive on their accounts, they must deposit them on their sight deposit account at the SNB.
Negative Interest ratesFurthermore, the SNB harms the Swiss economy, when it reduces the profits of Swiss banks by negative interest rates. But with this measure she maintains her own profitability. Still, as compared to the FX profits or gains on equities, this number is relatively low.
|
SNB Result for Swiss Franc Positions for Q1 2020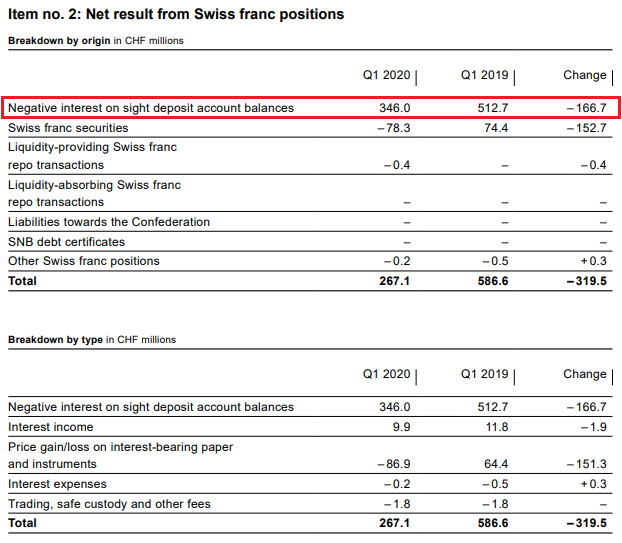 Source: snb.ch - Click to enlarge |
||||||||||||||||||||||||||||||||||||||||||||||||||||||
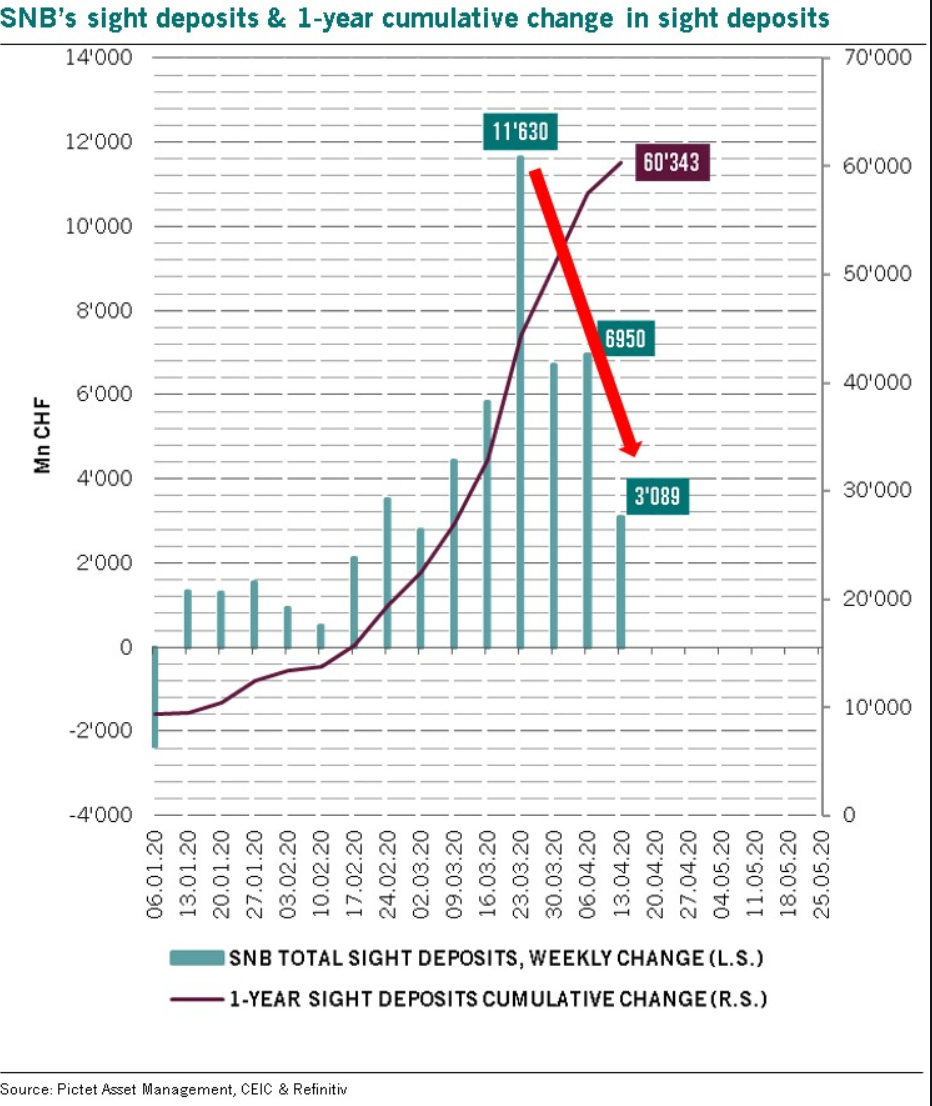
SNB LiabilitiesElectronic Money Printing: Sight Deposits Sight deposits are the biggest part of SNB interventions. In Q1 2020 the SNB intervened again, increasing sight deposits and its debt towards the Swiss state.
Paper PrintingBanknotes in circulation: -2.54 bn francs to 79.7 bn. CHF This old form of a printing press, today a less important form of central bank interventions. It showed that safe-haven Swiss francs, e.g. 1000 franc bank notes are currently less in demand than previously. |
SNB Liabilities and Sight Deposits for Q1 2020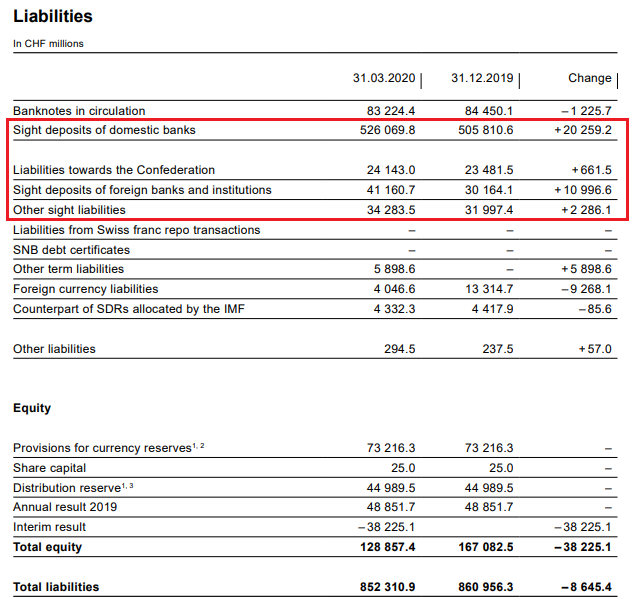 Source: snb.ch - Click to enlarge |
||||||||||||||||||||||||||||||||||||||||||||||||||||||
Provisions for currency reservesThe provisions for currency reserves cannot cover the potential loss 150 bn mentioned in the beginning for the inflation scenario. The SNB has only added the minimum of 8% of the result to these provisions. SNB’s Profit Game:
Then the SNB carries forward the profits of the previous years in form of a “distribution reserve”. The idea is to be able to pay a distribution/dividends even in bad years. Dividend yieldFor investors: The dividend yield is extremely low. Buying the SNB stocks is a bet on the stock price.
While the Swiss confederation and cantons, the SNB stock is a nice investment.
On the other side, they have a higher risk.
|
|
Tags: Featured,newsletter,SNB balance sheet,SNB equity holdings,SNB Gold Holdings,SNB profit,SNB results,SNB sight deposits,Swiss National Bank

