A four-day long descending triangle formation limits USD/CHF moves ahead of Swiss Unemployment Rate. 100-hour EMA offers an additional barrier to the upside. In addition to its choppy 11-pip trading range since morning, a four-day long descending triangle formation also limits USD/CHF pair moves as it trades near 0.9740 heading into Friday’s European market open. Investors will seek clues from Switzerland’s July month seasonally adjusted Unemployment Rate (MoM) that is expected to remain unchanged at 2.3%. While 0.9705 and 0.9780 define the extreme-lines of the triangle pattern, 0.9730 and 100-hour exponential moving average (EMA) level of 0.9770 can act as intermediate stops during either side momentum.
Topics:
Anil Panchal considers the following as important: 4) FX Trends, Featured, newsletter
This could be interesting, too:
Nachrichten Ticker - www.finanzen.ch writes Die Performance der Kryptowährungen in KW 9: Das hat sich bei Bitcoin, Ether & Co. getan
Nachrichten Ticker - www.finanzen.ch writes Wer verbirgt sich hinter der Ethereum-Technologie?
Martin Hartmann writes Eine Analyse nach den Lehren von Milton Friedman
Marc Chandler writes March 2025 Monthly
- A four-day long descending triangle formation limits USD/CHF moves ahead of Swiss Unemployment Rate.
- 100-hour EMA offers an additional barrier to the upside.
| In addition to its choppy 11-pip trading range since morning, a four-day long descending triangle formation also limits USD/CHF pair moves as it trades near 0.9740 heading into Friday’s European market open.
Investors will seek clues from Switzerland’s July month seasonally adjusted Unemployment Rate (MoM) that is expected to remain unchanged at 2.3%. While 0.9705 and 0.9780 define the extreme-lines of the triangle pattern, 0.9730 and 100-hour exponential moving average (EMA) level of 0.9770 can act as intermediate stops during either side momentum. Additionally, pair’s break of 0.9705 will have to slip beneath the monthly low of 0.9692 in order to aim for further downside whereas an upside clearance of 0.9780 can trigger fresh rise towards 50% Fibonacci retracement of a seven-day downpour, at 0.9834. |
USD/CHF hourly chart(see more posts on USD/CHF, )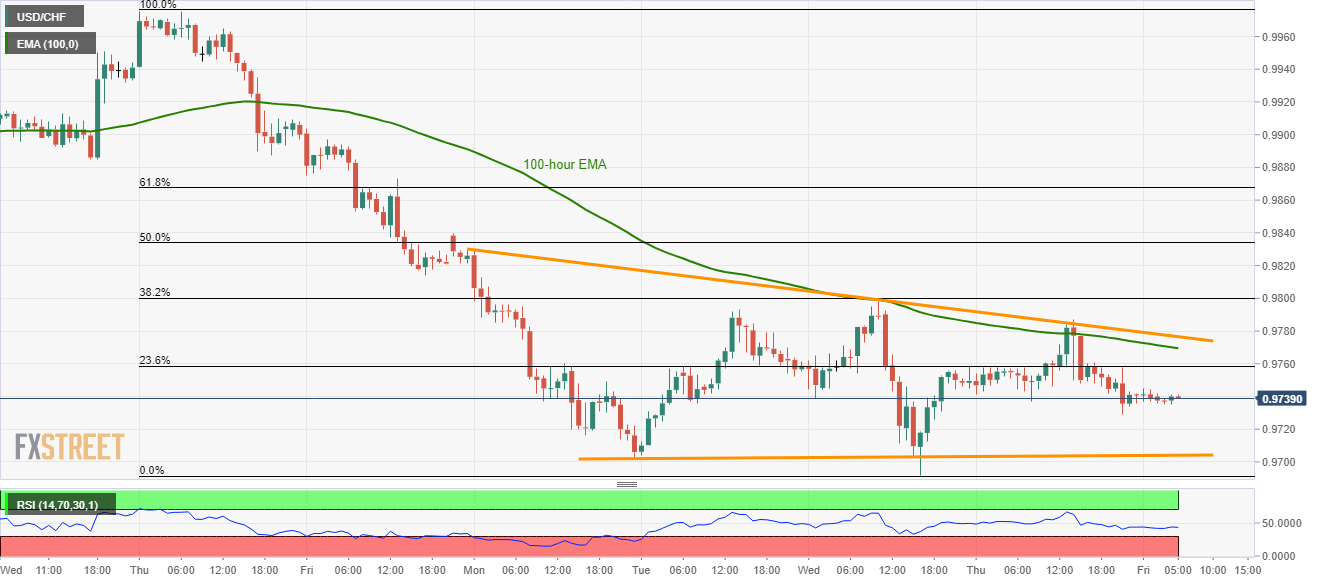 - Click to enlarge |
Trend: Sideways
Tags: Featured,newsletter