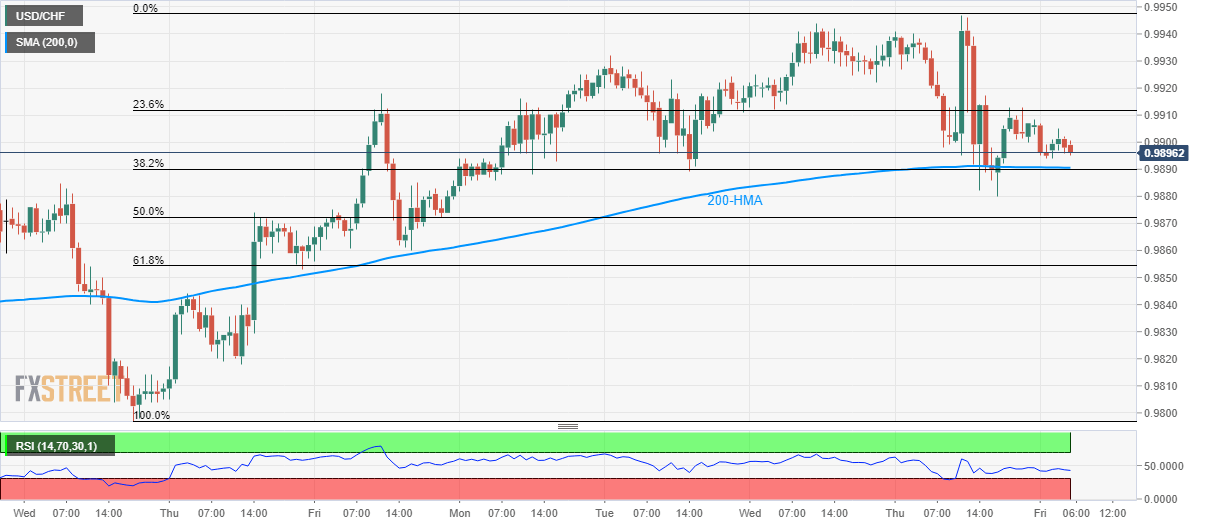
USD/CHF fails to sustain the bounce off key support-confluence including 200-HMA and 38.2% Fibonacci retracement. A downside break highlights the 61.8% Fibonacci retracement level while 200-DMA caps the upside. Failures to sustain the bounce off 200-hour moving average (HMA) and 38.2% Fibonacci retracement of latest run-up drag the USD/CHF back to the key support-confluence while taking rounds to 0.9900 ahead of Friday’s European open. Should prices slip below 0.9890 support-joint, 50% Fibonacci retracement around 0.9870 may offer an intermediate halt to its downpour to 61.8% Fibonacci retracement level of 0.9855. In a case where the quote keeps falling below 0.9855, 0.9820 and 0.9800 appear on the bears’ radar. Meanwhile, pair’s another pullback can have 0.9915
Topics:
Anil Panchal considers the following as important: 4.) FXStreet, 4) FX Trends, Featured, newsletter
This could be interesting, too:
Nachrichten Ticker - www.finanzen.ch writes Die Performance der Kryptowährungen in KW 9: Das hat sich bei Bitcoin, Ether & Co. getan
Nachrichten Ticker - www.finanzen.ch writes Wer verbirgt sich hinter der Ethereum-Technologie?
Martin Hartmann writes Eine Analyse nach den Lehren von Milton Friedman
Marc Chandler writes March 2025 Monthly
- USD/CHF fails to sustain the bounce off key support-confluence including 200-HMA and 38.2% Fibonacci retracement.
- A downside break highlights the 61.8% Fibonacci retracement level while 200-DMA caps the upside.
| Failures to sustain the bounce off 200-hour moving average (HMA) and 38.2% Fibonacci retracement of latest run-up drag the USD/CHF back to the key support-confluence while taking rounds to 0.9900 ahead of Friday’s European open.
Should prices slip below 0.9890 support-joint, 50% Fibonacci retracement around 0.9870 may offer an intermediate halt to its downpour to 61.8% Fibonacci retracement level of 0.9855. In a case where the quote keeps falling below 0.9855, 0.9820 and 0.9800 appear on the bears’ radar. Meanwhile, pair’s another pullback can have 0.9915 as immediate resistance ahead of confronting 200-day simple moving average (DMA) level of 0.9950 on the daily chart. Even if the 200-DMA has been restricting the pair’s upside since 12-weeks, a sustained break of which could easily fuel prices to 1.0000 round-figure. |
USD/CHF hourly chart, September 13(see more posts on EUR/CHF, ) |
Trend: sideways
Tags: Featured,newsletter

