USD/CHF takes the bids near 38.2% Fibonacci retracement of April-August downpour. 200-day EMA, four-month-old falling trend-line acts as key upside resistance. Despite breaking 50-day exponential moving average (EMA), USD/CHF remains below key resistance confluence as it takes rounds to 0.9880 during Friday’s Asian session. The pair needs to provide a daily closing beyond 0.9890/95 region including 100-day EMA and four-month-old descending trend-line in order justify its strength. In doing so monthly high surrounding 0.9975, 1.0000 round-figure and 61.8% Fibonacci retracement level of 1.0020 will flash on USD/CHF bulls’ radars. On the contrary, a pullback below 50-day EMA level of 0.9844 can fetch prices to 0.9800 mark comprising 23.6% Fibonacci retracement.
Topics:
Anil Panchal considers the following as important: 4.) FXStreet, 4) FX Trends, Featured, newsletter
This could be interesting, too:
Nachrichten Ticker - www.finanzen.ch writes Die Performance der Kryptowährungen in KW 9: Das hat sich bei Bitcoin, Ether & Co. getan
Nachrichten Ticker - www.finanzen.ch writes Wer verbirgt sich hinter der Ethereum-Technologie?
Martin Hartmann writes Eine Analyse nach den Lehren von Milton Friedman
Marc Chandler writes March 2025 Monthly
Despite breaking 50-day exponential moving average (EMA), USD/CHF remains below key resistance confluence as it takes rounds to 0.9880 during Friday’s Asian session. The pair needs to provide a daily closing beyond 0.9890/95 region including 100-day EMA and four-month-old descending trend-line in order justify its strength. In doing so monthly high surrounding 0.9975, 1.0000 round-figure and 61.8% Fibonacci retracement level of 1.0020 will flash on USD/CHF bulls’ radars. On the contrary, a pullback below 50-day EMA level of 0.9844 can fetch prices to 0.9800 mark comprising 23.6% Fibonacci retracement. However, an upward sloping trend-line since August 13, at 0.9740, could question further declines. |
USD/CHF Daily Chart, April - August 2019(see more posts on USD/CHF, )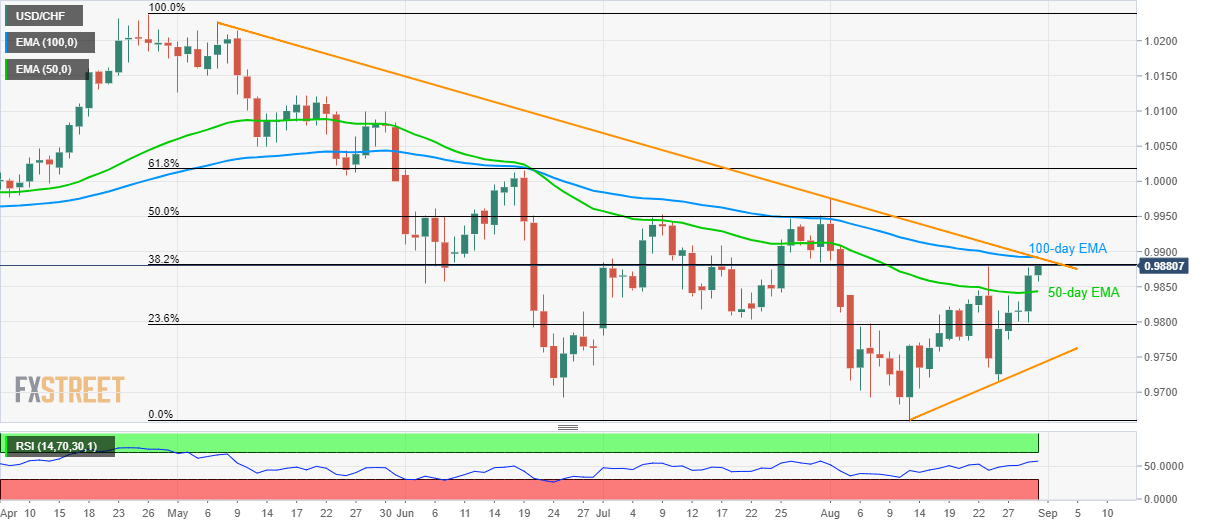 - Click to enlarge |
Trend: pullback expected
Tags: Featured,newsletter