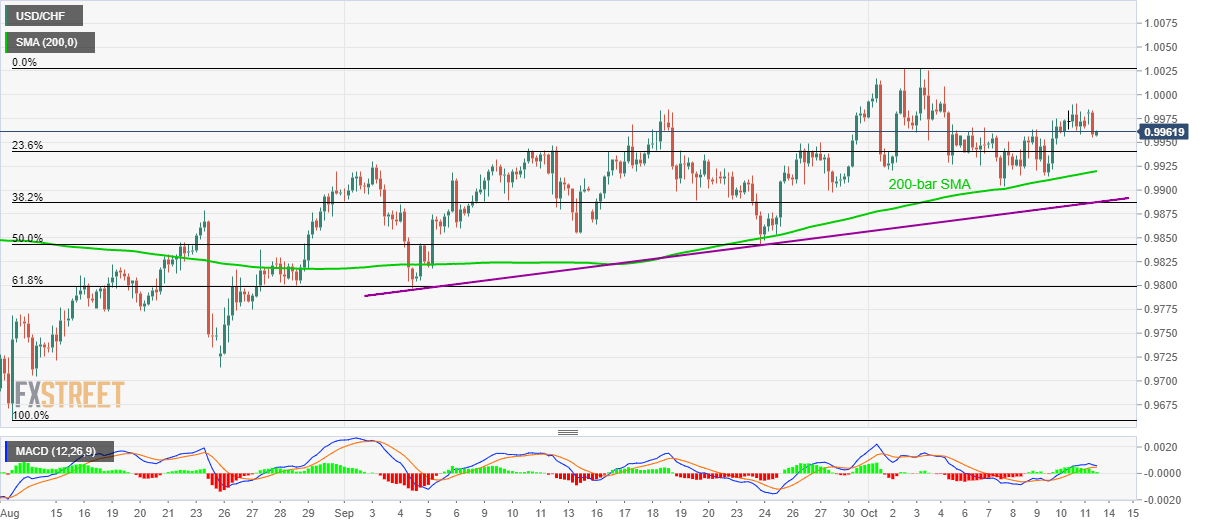
USD/CHF pulls back from 0.9990, 23.6% Fibonacci retracement on the sellers’ radar. 200-bar SMA, followed by rising multi-week-old rising trendline and 38.2% Fibonacci retracement, limit further declines. Despite witnessing a downside pressure off-late, the USD/CHF pair remains well above the key supports while taking rounds to 0.9960 amid pre-European open session on Monday. While 23.6% Fibonacci retracement of August–October upside, at 0.9940, seems to please short-term sellers, 200-bar Simple Moving Average (SMA) around 0.9920, will challenge bears afterward. If at all prices decline below 0.9920, 0.9890/87 area including an upward sloping trend-line since September 04 and 38.2% Fibonacci retracement will limit further downside, if not then 0.9840 and 0.9800,
Topics:
Anil Panchal considers the following as important: 1.) FXStreet on SNB&CHF, 1) SNB and CHF, Featured, newsletter
This could be interesting, too:
Nachrichten Ticker - www.finanzen.ch writes Die Performance der Kryptowährungen in KW 9: Das hat sich bei Bitcoin, Ether & Co. getan
Nachrichten Ticker - www.finanzen.ch writes Wer verbirgt sich hinter der Ethereum-Technologie?
Martin Hartmann writes Eine Analyse nach den Lehren von Milton Friedman
Marc Chandler writes March 2025 Monthly
- USD/CHF pulls back from 0.9990, 23.6% Fibonacci retracement on the sellers’ radar.
- 200-bar SMA, followed by rising multi-week-old rising trendline and 38.2% Fibonacci retracement, limit further declines.
| Despite witnessing a downside pressure off-late, the USD/CHF pair remains well above the key supports while taking rounds to 0.9960 amid pre-European open session on Monday.
While 23.6% Fibonacci retracement of August–October upside, at 0.9940, seems to please short-term sellers, 200-bar Simple Moving Average (SMA) around 0.9920, will challenge bears afterward. If at all prices decline below 0.9920, 0.9890/87 area including an upward sloping trend-line since September 04 and 38.2% Fibonacci retracement will limit further downside, if not then 0.9840 and 0.9800, comprising 61.8% Fibonacci retracement, could gain market attention. On the contrary, pair’s run-up beyond 0.9990 can again aim for 1.0030 while May-end tops nearing 1.0100 could lure bulls then after. |
USD/CHF 4-hour chart, October 14(see more posts on USD/CHF, ) |
Trend: pullback expected
Tags: Featured,newsletter

