Defending 3,800 and a Swing Trade Play For one week, bulls have been defending the 3,800 USD value area with success. But on March 4th they had to give way to the constant pressure. Prices fell quickly to the 3,700 USD level. These extended times of range bound trading are typical for Bitcoin Bottom Building in sideways ranges. This 60 minute chart of Bitcoin shows (represented by the yellow candlestick wicks) how the bulls defended 3,800 USD : BTC-USDT hourly, March-4 2019BTC/USDT 60 minute chart as of March 4th, 2019 - Click to enlarge If the closing price for BTCUSDT should be above and near 3,686 USD on March the 5th, a quick daily long play could provide a short term opportunity. Long entry opportunity on
Topics:
Korbinian Koller considers the following as important: 6) Gold and Austrian Economics, 6b) Austrian Economics, 7) Markets, Crypto-currencies, Featured, newsletter
This could be interesting, too:
Nachrichten Ticker - www.finanzen.ch writes Die Performance der Kryptowährungen in KW 9: Das hat sich bei Bitcoin, Ether & Co. getan
Nachrichten Ticker - www.finanzen.ch writes Wer verbirgt sich hinter der Ethereum-Technologie?
Martin Hartmann writes Eine Analyse nach den Lehren von Milton Friedman
Marc Chandler writes March 2025 Monthly
Defending 3,800 and a Swing Trade PlayFor one week, bulls have been defending the 3,800 USD value area with success. But on March 4th they had to give way to the constant pressure. Prices fell quickly to the 3,700 USD level. These extended times of range bound trading are typical for Bitcoin Bottom Building in sideways ranges. This 60 minute chart of Bitcoin shows (represented by the yellow candlestick wicks) how the bulls defended 3,800 USD : |
BTC-USDT hourly, March-4 2019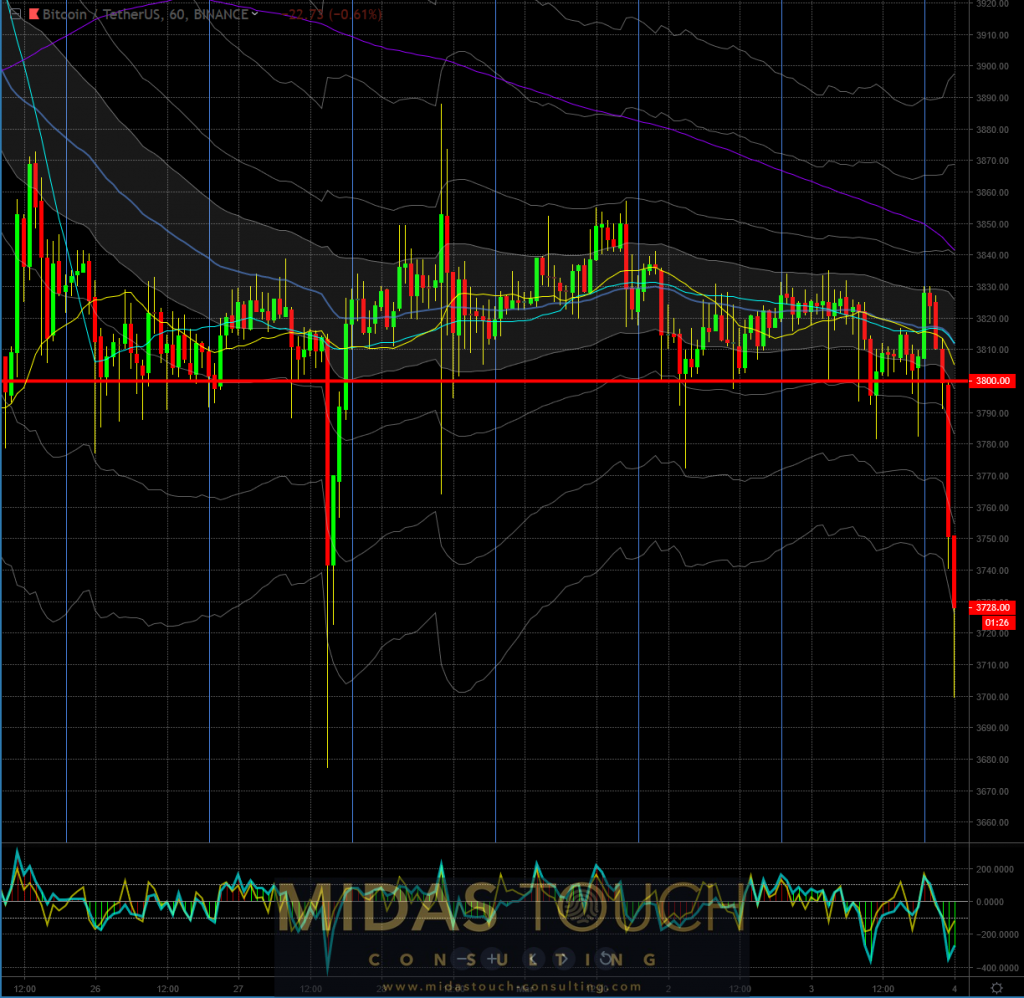 BTC/USDT 60 minute chart as of March 4th, 2019 - Click to enlarge |
| If the closing price for BTCUSDT should be above and near 3,686 USD on March the 5th, a quick daily long play could provide a short term opportunity.
Long entry opportunity on March 6th for daily swing trade long play: |
BTC/USDT daily, March 4th, 2019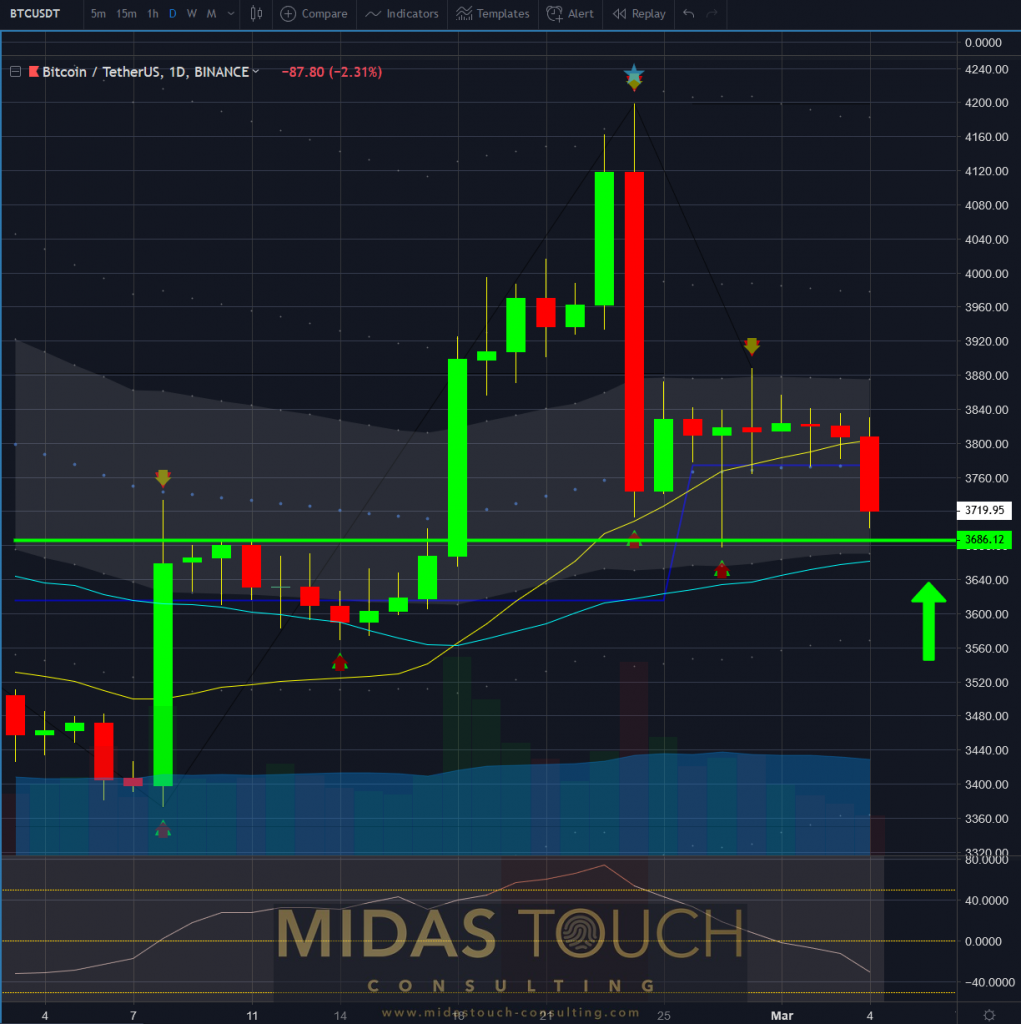 - Click to enlarge |
| It is important to see clearly that the weekly chart, as the more dominant higher time frame, is favoring the short side. As such the suggested swing play setup should be managed with our quad exit strategy, tight stops and a conservative target.
Larger time frames suggest this to be a counter directional play: |
BTC/USDT weekly, March 4th, 2019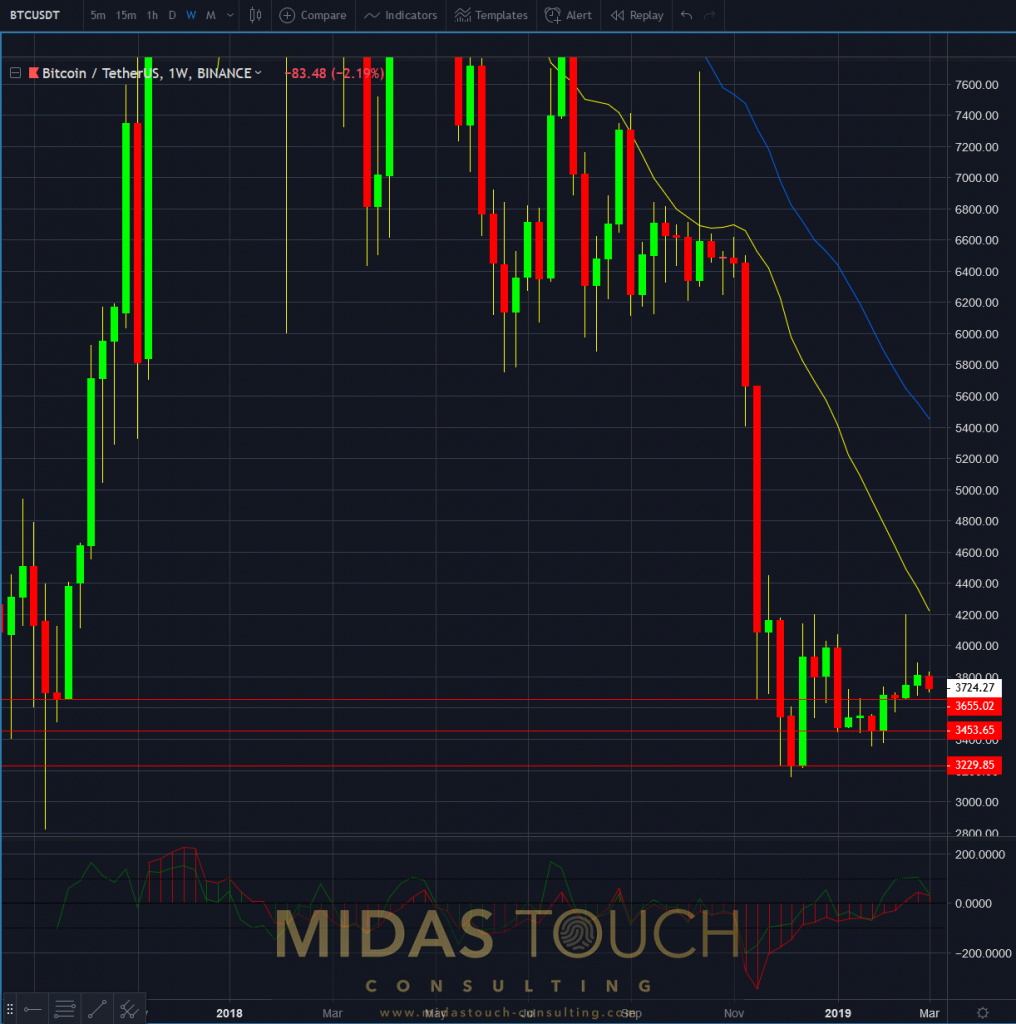 - Click to enlarge |
| This especially so since what has been support (3,800 USD) has now become resistance. The 4 hour market profile chart illustrates the overhead pressure. |
BTC/USDT 4 hour, March 4th, 2019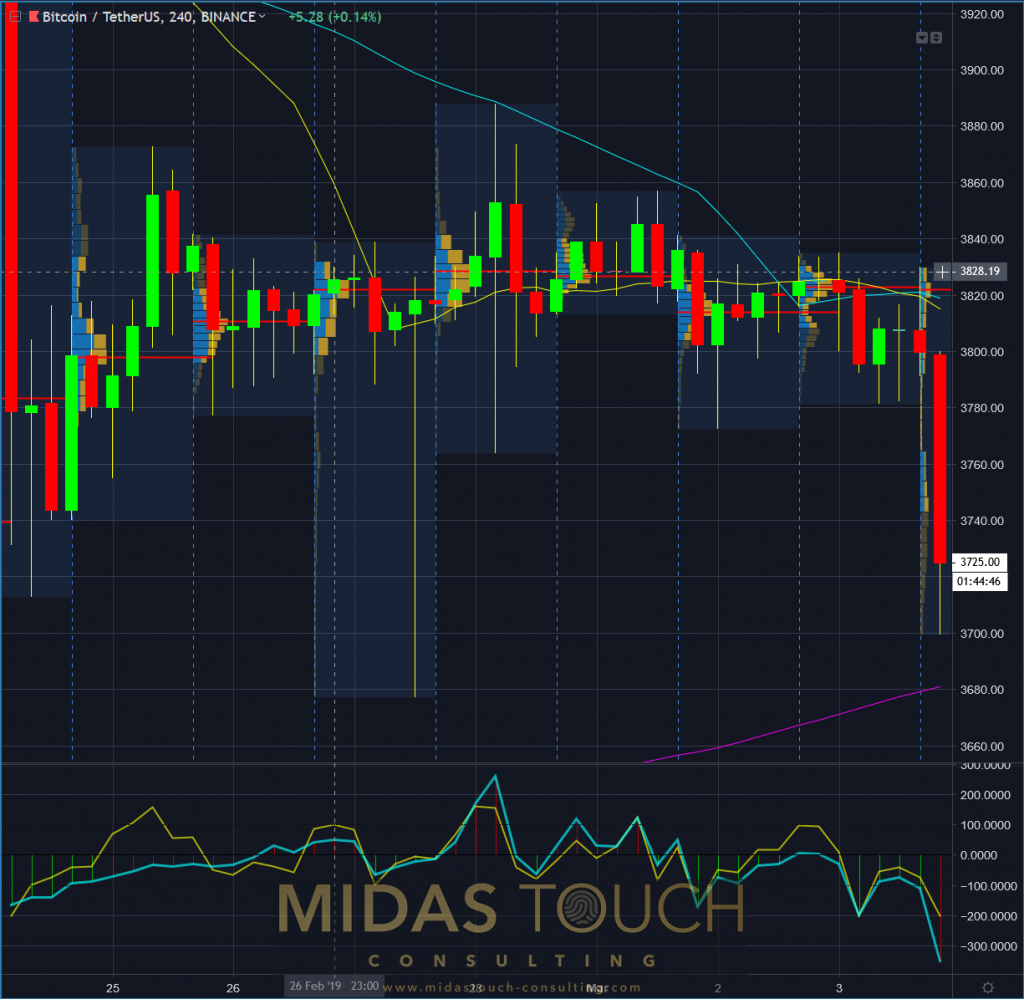 - Click to enlarge |
| It is prudent to attempt low risk entry points in a bottom building phase of the market, even though they might not look as attractive at first. No one knows when the market might turn. Being positioned early doesn’t hurt, if the risk parameters are very conservative.
All charts are posted timely in our telegram channel. Addendum by PT Unfortunately we were a little slow in posting this update by Midas Touch Consulting, or let us rather say, the crypto market is sometimes too fast for us. Here is what has happened since the above post was originally written: Given this good result, we thought it may still be an interesting update to re-post, even if the opportunity is gone. Readers who are into short term trading of cryptos may want to check out Korbinian Koller’s short term updates more frequently (see links above). |
BTC hourly, Mar 5, 2019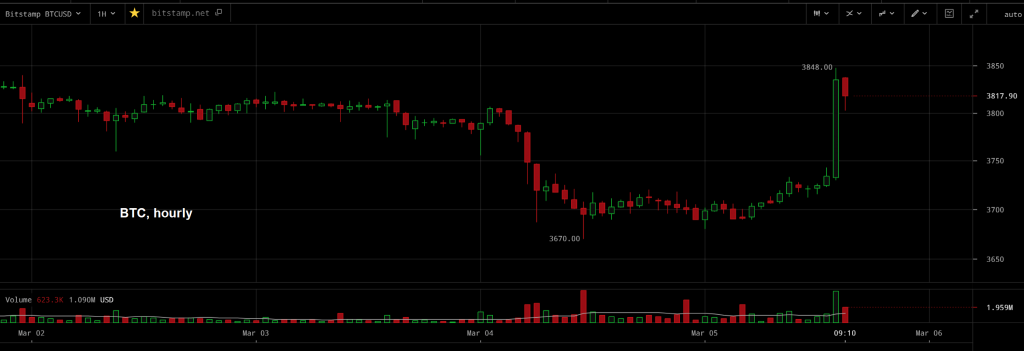 BTC hourly – it was indeed a great low-risk entry point for a short term swing trade. - Click to enlarge |
Charts by: Midas Touch Consulting, Cryptowatch
Tags: Crypto - Currencies,Featured,newsletter