Industrial Production in the United States rose 3.5% year-over-year in April 2018, down slightly from a revised 3.7% rise in March. US Industrial Production, Jan 2006 - May 2018(see more posts on U.S. Industrial Production, ) - Click to enlarge Since accelerating to 3.4% growth back in November 2017, US industry has failed to experience much beyond that clear hurricane-related boost. IP for prior months, particularly February and March 2018, were revised significantly lower. US Industrial Production, Jan 1995 - May 2018(see more posts on U.S. Industrial Production, ) - Click to enlarge The one big bright spot continues to be the energy sector. Oil production has blown through record highs of late, and
Topics:
Jeffrey P. Snider considers the following as important: 5) Global Macro, Auto Sales, Crude Oil, currencies, economy, Featured, Federal Reserve/Monetary Policy, industrial production, industry, manufacturing, Markets, Mining, Motor Vehicle Assemblies, newsletter, The United States, U.S. Industrial Production, U.S. Motor Vehicle Assemblies, vehicle sales
This could be interesting, too:
Nachrichten Ticker - www.finanzen.ch writes Die Performance der Kryptowährungen in KW 9: Das hat sich bei Bitcoin, Ether & Co. getan
Nachrichten Ticker - www.finanzen.ch writes Wer verbirgt sich hinter der Ethereum-Technologie?
Martin Hartmann writes Eine Analyse nach den Lehren von Milton Friedman
Marc Chandler writes March 2025 Monthly
| Industrial Production in the United States rose 3.5% year-over-year in April 2018, down slightly from a revised 3.7% rise in March. |
US Industrial Production, Jan 2006 - May 2018(see more posts on U.S. Industrial Production, ) - Click to enlarge |
| Since accelerating to 3.4% growth back in November 2017, US industry has failed to experience much beyond that clear hurricane-related boost. IP for prior months, particularly February and March 2018, were revised significantly lower. |
US Industrial Production, Jan 1995 - May 2018(see more posts on U.S. Industrial Production, ) - Click to enlarge |
| The one big bright spot continues to be the energy sector. Oil production has blown through record highs of late, and growth continues to be actually robust. Year-over-year, crude production was up an impressive 16%, the highest rate of expansion since early 2015. The energy sector has now fully rebounded from the oil crash of the “rising dollar” and is back to its 2014 condition. |
US Industrial Production, Jan 2006 - May 2018(see more posts on U.S. Industrial Production, )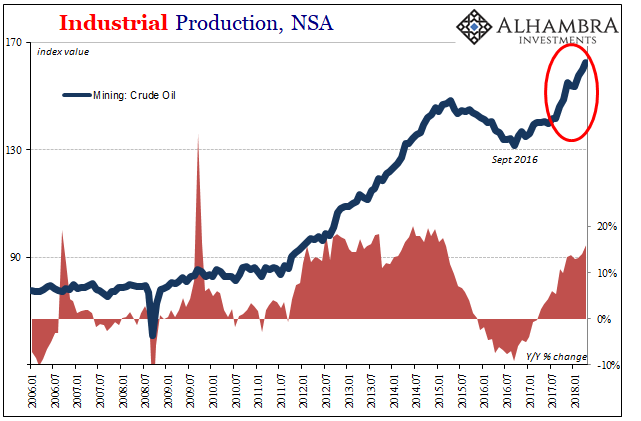 - Click to enlarge |
| On the flipside, US manufacturing remains stuck in low levels of expansion even after experiencing a prolonged recession during the 2015-16 downturn. The IP index for Manufacturing was up just 2% year-over-year in April, down from 2.7% in March and 2.3% in February. Any of these rates are about half of what we would expect of a healthy and comprehensively growing economy. |
US Industrial Production, Jan 2011 - May 2018(see more posts on U.S. Industrial Production, ) - Click to enlarge |
| This sector, too, is back to levels of expansion last experienced four years ago. Unfortunately for the US economy, unlike in energy 2014 wasn’t a particularly robust period for manufacturers. To be only growing at that pace after being forced (“unexpectedly”) into almost two years of contraction in between isn’t a positive sign, and certainly does not suggest that anything has changed as a baseline indication. |
US Motor Vehicle Assemblies, Jan 2013 - May 2018(see more posts on U.S. Motor Vehicle Assemblies, )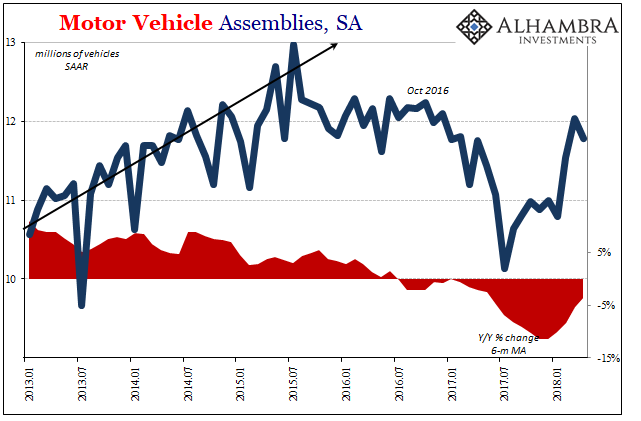 - Click to enlarge |
| One of the pieces holding it back is the auto sector. Domestic motor vehicle production has been extremely volatile since early last year. The destruction of so many thousands of vehicles by Harvey and to a lesser extent Irma is partially to blame for the big swings, but overall the problem is really a simple macro imbalance. |
US Motor Vehicle Sales and Production, Jan 2011 - May 2018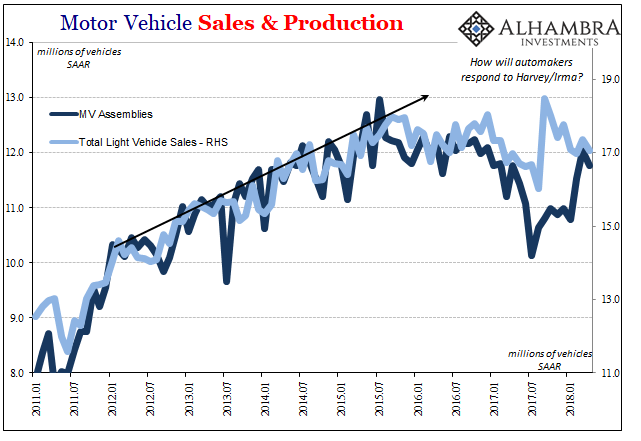 - Click to enlarge |
| Sales outside of the immediate aftermath of the hurricanes have trended again on the weaker side of this “plateau.” It has to be a difficult climate for automakers to try and navigate and therefore make sense of, particularly when facing a starting position where inventory was so heavily imbalanced at the top ends.
Motor vehicle assemblies rebounded sharply this February from the big drop late last year, rising to a 12 million seasonally-adjusted annual rate in March. They declined to 11.77 million in April. While these numbers are better than those in the second half of last year, they are at the weaker end of the first half of 2017. In other words, as the hurricane effects dissipate here, too, it doesn’t appear that manufacturers are expecting anything to change with sales (and a couple have signaled their view that this might be as good as it gets on the upside with significant downside risks). |
US Motor Vehicle Sales, Jan 2011 - May 2018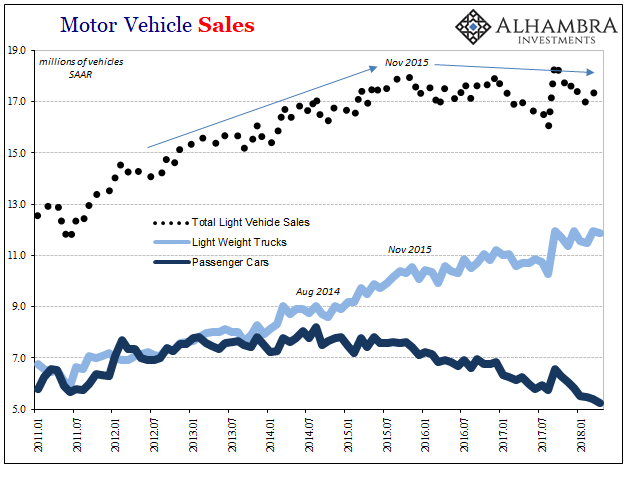 - Click to enlarge |
| One group of forward-looking indicators within the IP series is the diffusion indices. The shorter versions (1-month & 3-month) are starting to trend lower after noticeable increases following Harvey and Irma. The 1-month diffusion index actually pegged below 50 in March (this data is one month further in arrears) for the first time since last May. In January, it was estimated at just 50.3, meaning that for two out of the last three months of data the picture for new orders has been at best mixed. |
US Industrial Production, Jan 2015 - May 2018(see more posts on U.S. Industrial Production, )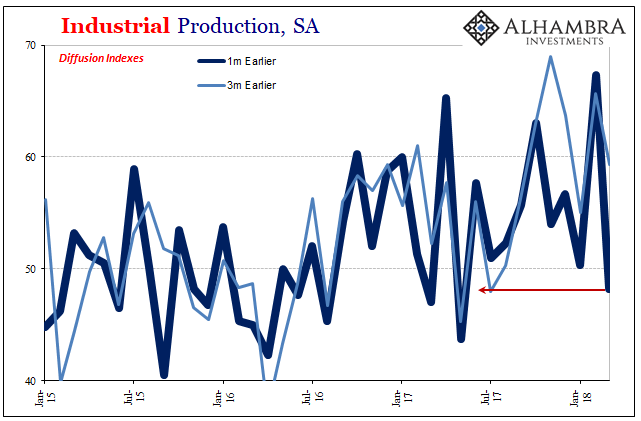 - Click to enlarge |
The last time these indices were in this state was last year several months prior to the tropical storms. Around that time and in the summer months that followed, overall IP, and the auto segment in particular, hit a lull in activity suggesting a widespread denouement in the US economy leading up to the later weather disruptions.
The narrative continues to be globally synchronized growth and while that may be true in the technical sense of an absence of headline negative numbers, here we see in US IP why it has been such a hollow and ultimately unfulfilled concept. American industry, like elsewhere in the world, is far from synchronous inside its expansion. That’s been the problem since at least 2011, where only bits and pieces (oil) at any one time are truly robust while others (now autos) remain closer to, if not actually in, contraction.
They can never seem to really match up as they would, and have, in true expansions or booms. It’s globally synchronized asynchronous growth.
Tags: Auto Sales,Crude Oil,currencies,economy,Featured,Federal Reserve/Monetary Policy,industrial production,industry,manufacturing,Markets,Mining,Motor Vehicle Assemblies,newsletter,U.S. Industrial Production,U.S. Motor Vehicle Assemblies,vehicle sales