We do not like Purchasing Power or Real Effective Exchange Rate (REER) as measurement for currencies. For us, the trade balance decides if a currency is overvalued. Only the trade balance can express productivity gains, while the REER assumes constant productivity in comparison to trade partners. Who has read Michael Pettis, knows that a rising trade surplus may also be caused by a higher savings rate while the trade partners decided to spend more. This is partially true. Recently Europeans started to increase their savings rate, while Americans reduced it. This has led to a rising trade and current surplus for the Europeans. But also to a massive Swiss trade surplus with the United States, that lifted Switzerland on
Topics:
George Dorgan considers the following as important: 2) Swiss and European Macro, Featured, newsletter, Switzerland Exports, Switzerland Exports by Sector, Switzerland Imports, Switzerland Imports by Sector, Switzerland Trade Balance
This could be interesting, too:
Nachrichten Ticker - www.finanzen.ch writes Die Performance der Kryptowährungen in KW 9: Das hat sich bei Bitcoin, Ether & Co. getan
Nachrichten Ticker - www.finanzen.ch writes Wer verbirgt sich hinter der Ethereum-Technologie?
Martin Hartmann writes Eine Analyse nach den Lehren von Milton Friedman
Marc Chandler writes March 2025 Monthly
We do not like Purchasing Power or Real Effective Exchange Rate (REER) as measurement for currencies. For us, the trade balance decides if a currency is overvalued. Only the trade balance can express productivity gains, while the REER assumes constant productivity in comparison to trade partners.
Who has read Michael Pettis, knows that a rising trade surplus may also be caused by a higher savings rate while the trade partners decided to spend more. This is partially true.
Recently Europeans started to increase their savings rate, while Americans reduced it. This has led to a rising trade and current surplus for the Europeans.
But also to a massive Swiss trade surplus with the United States, that lifted Switzerland on the U.S. currency manipulation watch list.
To control the trade balance against this “savings effect”, economists may look at imports. When imports are rising at the same pace as GDP or consumption, then there is no such “savings effect”.
After the record trade surpluses, the Swiss economy may have turned around: consumption and imports are finally rising more.
Swiss National Bank wants to keep non-profitable sectors alive
Swiss exports are moving more and more toward higher value sectors: away from watches, jewelry and manufacturing towards chemicals and pharmaceuticals. With currency interventions, the SNB is trying to keep sectors alive, that would not survive without interventions.
At the same time, importers keep the currency gains of imported goods and return little to the consumer. This tendency is accentuated by the SNB, that makes the franc weaker.
Texts and Charts from the Swiss customs data release (translated from French).
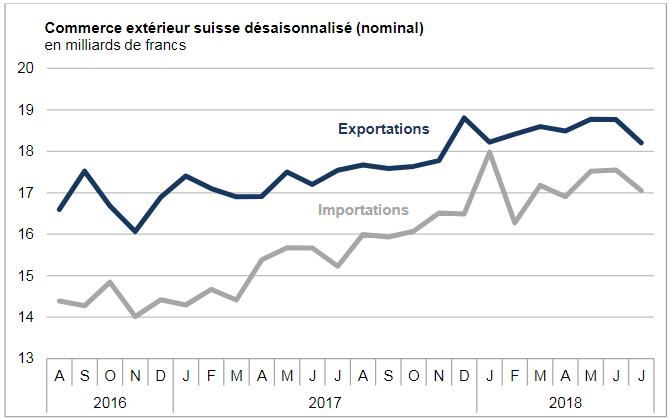
Exports and Imports YoY DevelopmentAfter stagnating the previous month, both exports and imports fell in July 2018. In seasonally adjusted terms, they fell by 3.0 and 2.8%, respectively. The decline in the chemicals-pharmaceuticals sector weighed on the result in both directions of the traffic. The trade balance is closing with a surplus of 1.2 billion francs. ▼ Reduction of trade with Europe |
Swiss exports and imports, seasonally adjusted (in bn CHF), July 2018(see more posts on Switzerland Exports, Switzerland Imports, ) |
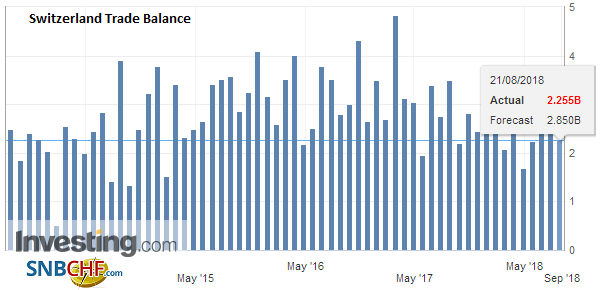
Overall evolutionAfter stagnating the previous month, seasonally adjusted exports contracted by 3.0% in July 2018 (actual: -1.4%). They thus report a drop in the diet, at a high level, however. Imports fell 2.8% (real: -1.4%) to show a similar trend to exports. The trade balance recorded a surplus of 1154 million francs. |
Switzerland Trade Balance, July 2018(see more posts on Switzerland Trade Balance, ) Source: Investing.com - Click to enlarge |
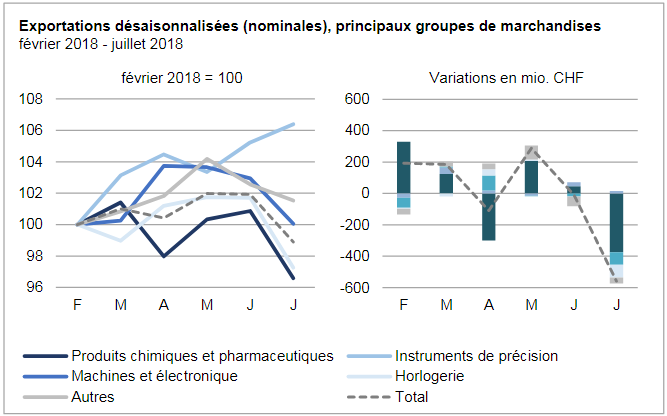
ExportsDecrease in exports in almost all sectorsWith the exception of precision instruments (+ 1.1%) and the textiles, clothing and footwear sector, all groups of merchants experienced a decline in exports in July. The overall decrease of CHF 558 million came from the flagship sector, chemicals and pharmaceuticals (-375 million francs, -4.2%). Here, the immuno-logical products have particularly suffered (-224 million francs). Watchmaking (-4.4%) and the machinery and electronics sector (-2.8%) also suffered a setback; for these two groups, the slowdown observed since May 2018 continued. Among other goods, sales of jewelery and jewelery plunged 10.4% (-114 million francs). The decline in exports only gained ground in Europe (-9.2%), the main market; this one, despite everything, on a positive trend started in August 2017. The fall of a fifth of Austria, France and the Netherlands has sealed the European result. In revenue growth of 7.2% over one month, revenue from Asia is on a rising trend. Japan (+112 million francs) and Hong Kong (+71 million) made the largest contributions, confirming at the same time their positive trend. Exports to North America also increased (+ 0.7%, USA: -0.1%). |
Swiss Exports per Sector February 2018 vs. July 2018(see more posts on Switzerland Export, Switzerland Exports by Sector, ) |
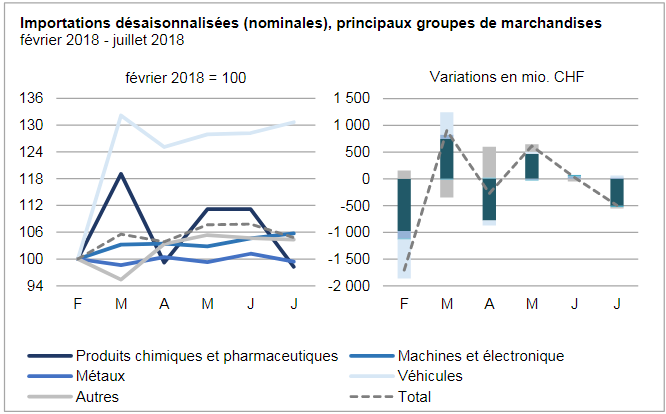
ImportsVolatile evolution of imports of chemicals and pharmaIn July 2018, imports contracted by 494 million francs, led by chemicals and pharmaceuticals (-11.6%). Here, active ingredients (-267 million francs), immunological products (-168 million) and drugs (-70 million francs) weighed on the result. The volatile evolution of the previous months has thus continued. Despite a 1.7% drop in July, metallurgy still has a flat trend. Imports of vehicles (+31 million francs) and machinery and electronics (+29 million), on the other hand, strengthened, confirming their growth in previous months. In addition to North America (-6.7%, USA: -94 million francs), Europe (-487 million francs) greatly influenced the decline in imports. Those from Asia, on the other hand, gained 2.8%. On the Old Continent, Ireland (-306 million francs) and Germany (-218 million) pulled the result down. The Asian rise, for its part, was based on the United Arab Emirates (+444 million francs, jewelery), whose arrivals have quadrupled since the beginning of the year. |
Swiss Imports per Sector February 2018 vs. July 2018(see more posts on Switzerland Imports, Switzerland Imports by Sector, ) |
Tags: Featured,newsletter,Switzerland Exports,Switzerland Exports by Sector,Switzerland Imports,Switzerland Imports by Sector,Switzerland Trade Balance


