See the introduction and the video for the terms gold basis, co-basis, backwardation and contango. Fundamental Developments There were big moves in the metals markets this week. The price of gold was up an additional and that of silver %excerpt%.30. Will the dollar fall further?As always, we are interested in the fundamentals of supply and demand as measured by the basis. But first, here are the charts of the prices of gold and silver, and the gold-silver ratio. Gold and Silver Price(see more posts on gold price, silver price, )Gold and silver prices in USD terms (as of last week Friday) - Click to enlarge Gold:Silver Ratio Next, this is a graph of the gold price measured in silver, otherwise known as the gold to
Topics:
Keith Weiner considers the following as important: Chart Update, dollar price, Featured, Gold, Gold and its price, gold basis, Gold co-basis, gold price, newsletter, Precious Metals, silver, silver basis, Silver co-basis, silver price
This could be interesting, too:
Nachrichten Ticker - www.finanzen.ch writes Die Performance der Kryptowährungen in KW 9: Das hat sich bei Bitcoin, Ether & Co. getan
Nachrichten Ticker - www.finanzen.ch writes Wer verbirgt sich hinter der Ethereum-Technologie?
Martin Hartmann writes Eine Analyse nach den Lehren von Milton Friedman
Marc Chandler writes March 2025 Monthly
See the introduction and the video for the terms gold basis, co-basis, backwardation and contango.
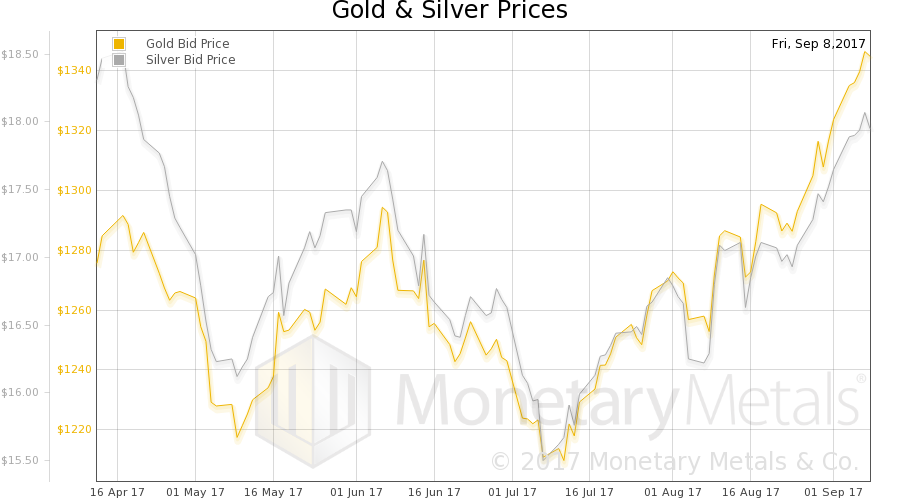
Fundamental DevelopmentsThere were big moves in the metals markets this week. The price of gold was up an additional $21 and that of silver $0.30. Will the dollar fall further?As always, we are interested in the fundamentals of supply and demand as measured by the basis. But first, here are the charts of the prices of gold and silver, and the gold-silver ratio. |
Gold and Silver Price(see more posts on gold price, silver price, ) |
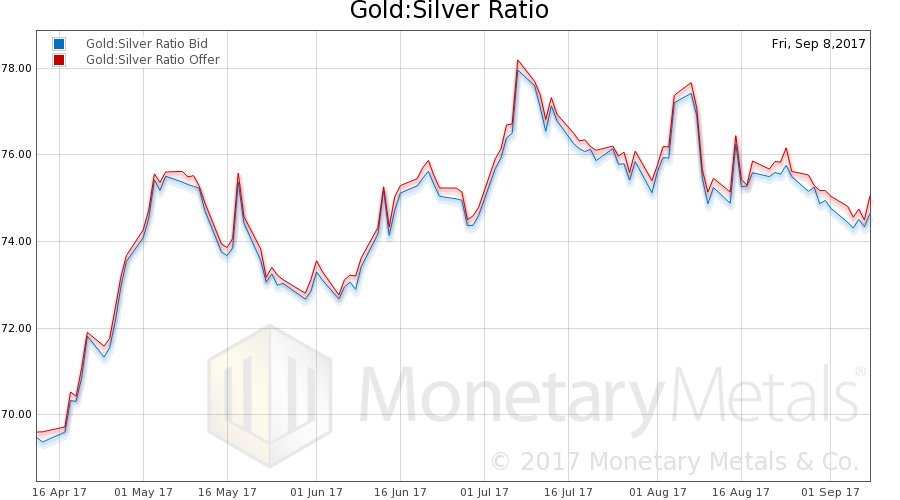
Gold:Silver RatioNext, this is a graph of the gold price measured in silver, otherwise known as the gold to silver ratio. The ratio was all but unchanged.
|
Gold:Silver Ratio(see more posts on gold silver ratio, ) |
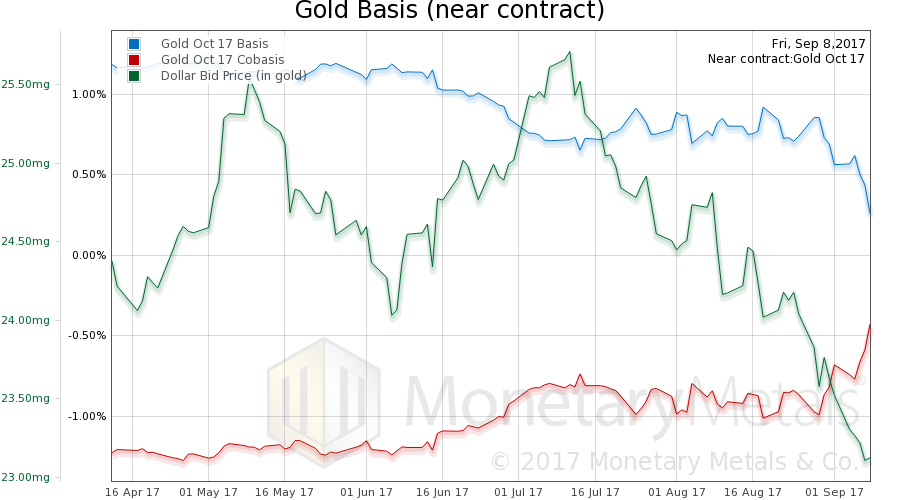
Gold Basis and Co-basis and the Dollar PriceHere is the gold graph (Oct contract), this time showing the trend since mid April. |
Gold Basis and Co-basis and the Dollar Price(see more posts on dollar price, Gold, gold basis, Gold co-basis, ) |
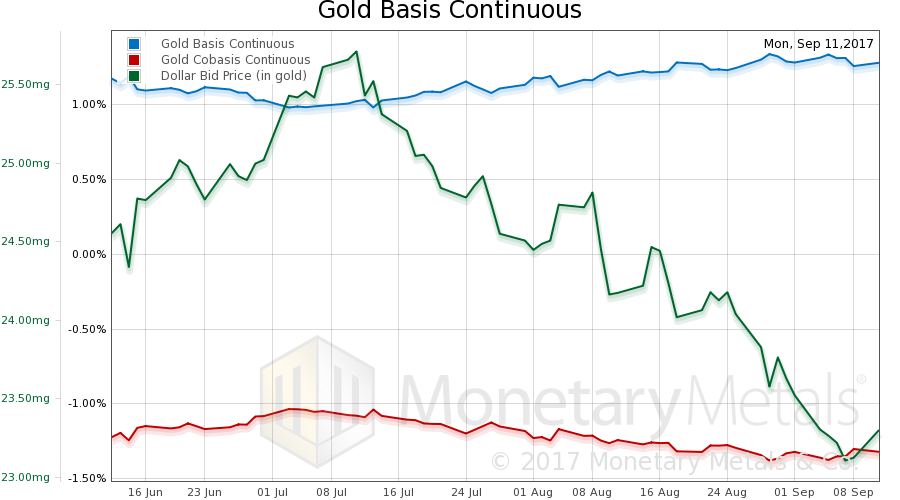
Gold Basis ContinuousThis is the October contract, which is under selling pressure (pushing basis down and co-basis up). However, there has been a significant drop in the dollar (the mirror image of how most people think of it, a rising gold price). Below is the continuous gold basis chart for comparison. |
Gold Basis Continuous(see more posts on gold basis, Gold co-basis, ) |
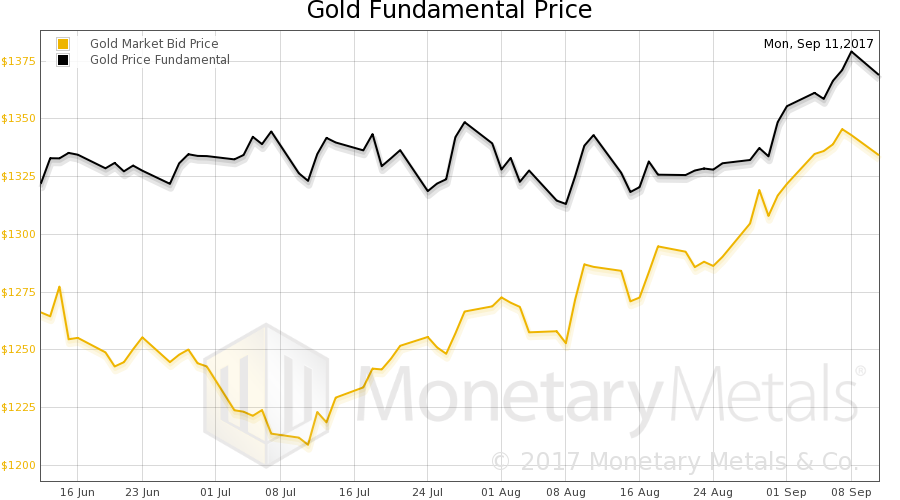
Gold Fundamental PriceThere is not much change in the continuous co-basis, as price rises (and as you can see above, the October co-basis rises along with it). The co-basis of -0.5% for October or -1.3% in continuous contract terms is not exactly screaming shortage. Yet the refusal of the co-basis to drop in the face of all this gold buying is. It feels a bit like a stealth bear market in the dollar (i.e., a stealth bull market in gold). Our calculated Monetary Metals fundamental gold price was up $22, to $1,379 as of Friday. |
Gold Fundamental Price(see more posts on gold price, ) |
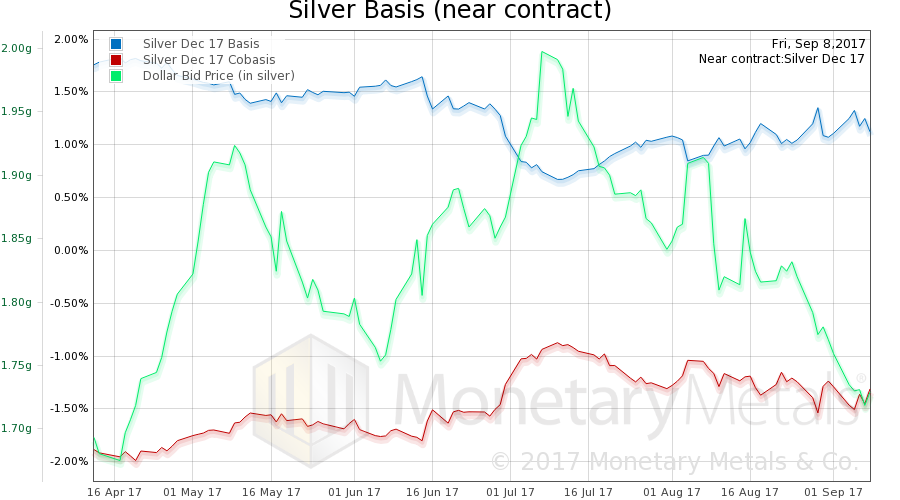
Silver Basis and Co-basis and the Dollar PriceNow let’s look at silver. In silver, we see a rising basis and falling co-basis in the December contract (mirrored by the continuous silver basis chart). |
Silver Basis and Co-basis and the Dollar Price(see more posts on dollar price, silver basis, Silver co-basis, ) |
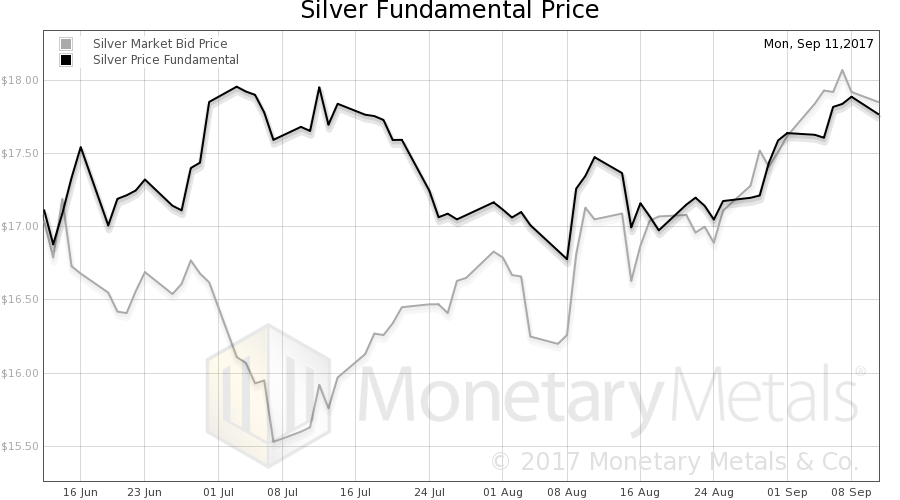
Silver Fundamental PriceOur calculated Monetary Metals fundamental silver price increased $0.25 to $17.89. |
Silver Fundamental Price(see more posts on silver price, ) |
© 2017Monetary Metals
Tags: Chart Update,dollar price,Featured,Gold,gold basis,Gold co-basis,gold price,newsletter,Precious Metals,silver,silver basis,Silver co-basis,silver price

