George Dorgan
My articles My siteAbout meMy booksMy videos
Follow on:TwitterFacebookGoogle +
CFA SocietySeeking Alpha
Swiss Franc Currency Index The Swiss Franc index gained nearly 3% last week, while the dollar index lost over 2%. This gives a total gain of 5%. Swiss Franc Index (see more posts on Swiss Franc Index) Click to enlarge. Swiss Franc Currency Index (3 years) The Swiss Franc index is the trade-weighted currency performance (see the currency basket) On a three years interval, the Swiss Franc had a weak performance. The dollar index was far stronger. The dollar makes up 40% of the SNB portfolio and of Swiss exports. Contrary to popular believe, the CHF index gained only 1.73% in 2015. It lost 9.52% in 2014., when the dollar (and yuan) strongly improved. Click to enlarge. USD/CHF The improvement of Swiss Franc index was reflected in the fall of the USD/CHF exchange from around 0.99 to 0.96. USD/CHF (see more posts on USD/CHF) US Dollar The US dollar lost ground against nearly all the major currencies last week. The sole exceptions were the Australian dollar, where pressure ahead of the weekend following Moody’s decision to cut the outlook for five Australian banks wiped out the previous small gain, and the Norwegian krone, which was really flat with less than a 0.1% loss. The dominant technical force in the Dollar Index is theretracement of the rally from early May. The 61.
Topics:
George Dorgan considers the following as important: Canadian Dollar, Crude Oil, EUR/CHF, Euro Dollar, Featured, FX Trends, MACDs, newslettersent, Swiss Franc Index, U.S. Treasuries, US Dollar Index, USD/CHF
This could be interesting, too:
Nachrichten Ticker - www.finanzen.ch writes Die Performance der Kryptowährungen in KW 9: Das hat sich bei Bitcoin, Ether & Co. getan
Nachrichten Ticker - www.finanzen.ch writes Wer verbirgt sich hinter der Ethereum-Technologie?
Marc Chandler writes March 2025 Monthly
Mark Thornton writes Is Amazon a Union-Busting Leviathan?
Swiss Franc Currency IndexThe Swiss Franc index gained nearly 3% last week, while the dollar index lost over 2%. This gives a total gain of 5%. |
Swiss Franc Index(see more posts on Swiss Franc Index)  Click to enlarge. |
Swiss Franc Currency Index (3 years)The Swiss Franc index is the trade-weighted currency performance (see the currency basket) On a three years interval, the Swiss Franc had a weak performance. The dollar index was far stronger. The dollar makes up 40% of the SNB portfolio and of Swiss exports. Contrary to popular believe, the CHF index gained only 1.73% in 2015. It lost 9.52% in 2014., when the dollar (and yuan) strongly improved. |
 Click to enlarge. |
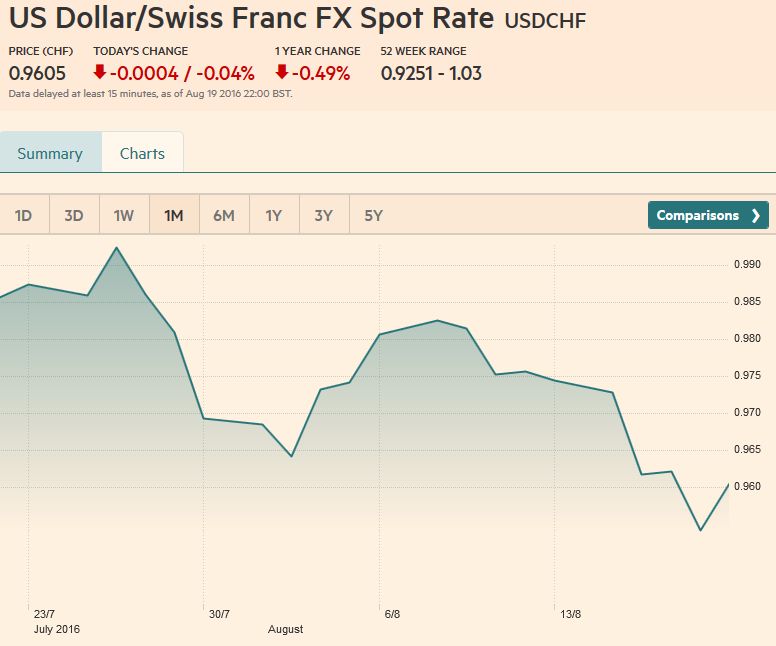
USD/CHFThe improvement of Swiss Franc index was reflected in the fall of the USD/CHF exchange from around 0.99 to 0.96. |
USD/CHF(see more posts on USD/CHF)
|
US DollarThe US dollar lost ground against nearly all the major currencies last week. The sole exceptions were the Australian dollar, where pressure ahead of the weekend following Moody’s decision to cut the outlook for five Australian banks wiped out the previous small gain, and the Norwegian krone, which was really flat with less than a 0.1% loss. The dominant technical force in the Dollar Index is the The first objective is 95.00, but there may be potential toward Rate Hike OddsAccording to Bloomberg probability calculation the odds have |
US Dollar Index(see more posts on the US Dollar Index)
|
EUR/USDThe euro is the biggest constituent in the Dollar Index, but it is not nearly as constructive. The euro has recouped more than 61.8% of its decline since early-May (~$1.1325). It has risen in eight of the past ten sessions. Despite the pullback before the weekend, it did not break the previous session’s low once last week. Moreover, it remains above the breakout from the downtrend line from early-May. That trendline is found near $1.1230 at the start of the new week and $1.1210 at the end of the week. Although it is bumping against the upper Bollinger Band, the technical risk may extend toward pre-Brexit high (~$1.1400-$1.1430). |
Euro Dollar(see more posts on the EUR/USD)  Click to enlarge. |
USD/JPYThe dollar slipped through the psychologically and technically significant JPY100 level. Although it traded below there in three of the past four sessions, the break has not yet been convincing. It has popped back above there and has not yet spent an entire session below JPY100. We suggest that a convincing break could confirm a rare but not unprecedented continuation head and shoulders pattern. The measuring objective of the pattern would project dollar losses toward JPY92.50. The dollar’s upside is initially blocked by the JPY100.50 area, and a break it could see This is especially true if our hypothesis of the break of JPY100 being spurred not by Fed views. Simply put, between the coupon payment of $37.5 bln, of which Japanese investors are among the largest recipients and $54.6 bln maturing; with only $62 bln of new supply, freed up some $30 bln. Given the cost of hedging and the outperformance of other bond markets, we hypothesized that this is what weighed on the dollar, especially against the yen. |
Dollar Yen(see more posts on the USD/JPY)  Click to enlarge. |
GBP/USD
Sterling posted an outside down day ahead of the weekend after reaching $1.3185 with the helped a series of data that seemed to indicate less immediate impact from the UK referendum than expected. Consumer prices a touch firmer than expected, but the key was the resilience of the labor market and retail sales. The rally that began with the lowest close in more than 30 years (~$1.2865) on August 15 (the 45th
anniversary of Bretton Woods) was stopped in its tracks by new reports citing two unnamed UK officials indicating that Prime Minister May wants to trigger Article 50 by April 2017, ahead of the German and French elections. Admittedly there are numerous spins, and until the Prime Minister herself confirms this intent, many will rightfully remain skeptical. We think it is believable and consistent with May’s
likely signals to other European officials. On the pre-weekend sell off, sterling held the 50% retracement of the rally off the August 15 low near $1.3025. Additional support is seen near $1.2985, but it that does not hold a return to $1.2865 looks likely, especially if the general US dollar tone improves.
|
GBP/USD(see more posts on the British pound)  Click to enlarge. |
AUD/USDThe technical condition of the Australian dollar has deteriorated. It was the weakest currency last week, losing almost 0.5% against the US dollar. The entire loss for the week was recorded at the end of the week after Moody’s cut the outlooks for five Australian banks. Last week’s high, like the week before, was close to a three-year downtrend line found near $0.7850. It failed, and appeared more like an Olympic boxer who hits an opponent at the end of his reach Before this week, the Aussie had climbed in 11 of the past 12 weeks since the end of May. We had identified initial support near $0.7600, which largely remained intact before the weekend. The technical indicators we use suggest further losses are likely in the period ahead. The next target is in the $0.7530-$0.7550 area, and then $0.7450. Initial resistance is seen near $0.7650. |
AUD/USD(see more posts on the Australian Dollar)  Click to enlarge. |
USD/CADThe US dollar has also been retracing its rally that began in early-May against the Canadian dollar. On August 19, it met the 61.8% retracement target to nearly the tick (CAD1.2764). The disappointing June retail sales (-0.1% vs. expectations for a 0.5% increase) and downward revisions to the May series (to flat from +0,2%), coupled with a soft headline July CPI (-0.2% vs. flat expectation) helped the greenback recovery before the weekend. The initial target now is near CAD1.2930, but near-term potential may exist toward CAD1.30. |
USD/CAD(see more posts on the Canadian Dollar)  Click to enlarge. |
Crude OilThe price of light sweet crude oil rose 8.5% last week, the most in five months. Some speculation that OPEC can agree to a output freeze as early as next month, which no one seems to believe, coupled with the largest decline in US inventories in five weeks, and the inventory of fuels fell for the third consecutive week helped prices. Reports also indicated that the surplus stored in ships in the North Sea were also being reduced. Its advancing streak stands at three weeks, and seven consecutive sessions. The rally has surpassed the 61.8% retracement objective ($49.60) of the decline since early-June saw $53.00 a barrel. The Stochastics are warning that a near-term top may be approaching, and the October contract continues to bump along the upper Bollinger Band. However, the RSI and MACD may make momentumtraders hesitant about picking a top.
|
Crude Oil (one year chart)(see more posts for Crude Oil)  Click to enlarge. Source Bloomberg.com |
US TreasuriesWith a few exceptions, the US 10-year yield has chopped between 1.50% and 1.60% for the past month. The light economic calendar warns this may continue in the coming days. The September note futures were somewhat weaker, with the lost close in nearly a month posted before the weekend. The 131-19 area is important. It marks the low from July 21. A break would signal a move toward 131-00, the highs from April, May, and early-June. |
US Treasuries
(one year char)  Click to enlarge. Source Bloomberg.com |
S&P 500The S&P 500 closed fractionally lower last week. It is the second weekly loss in the past eight weeks. After reaching a high near 2194 at the start of the week, it was sold to 2168 by midweek. It finished the week near the middle of that range; trading broadly sideways for the second week. The technical indicators continue to warn of weakening internals, but the market remains resilient. A break may be confirmed by a close below the 20-day moving average (~2175.7), which it has not done since late-June. |
 Click to enlarge. |

Charts and CHF data added by George Dorgan and the snbchf team, Text Posted by Marc Chandler on Marc to Markets,