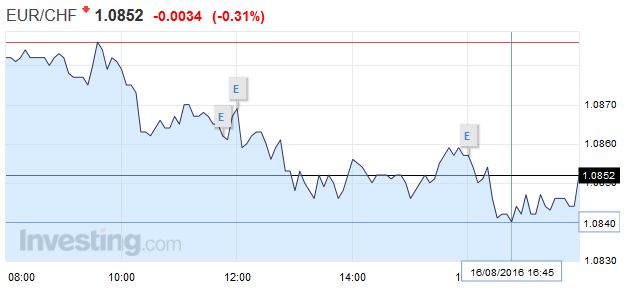
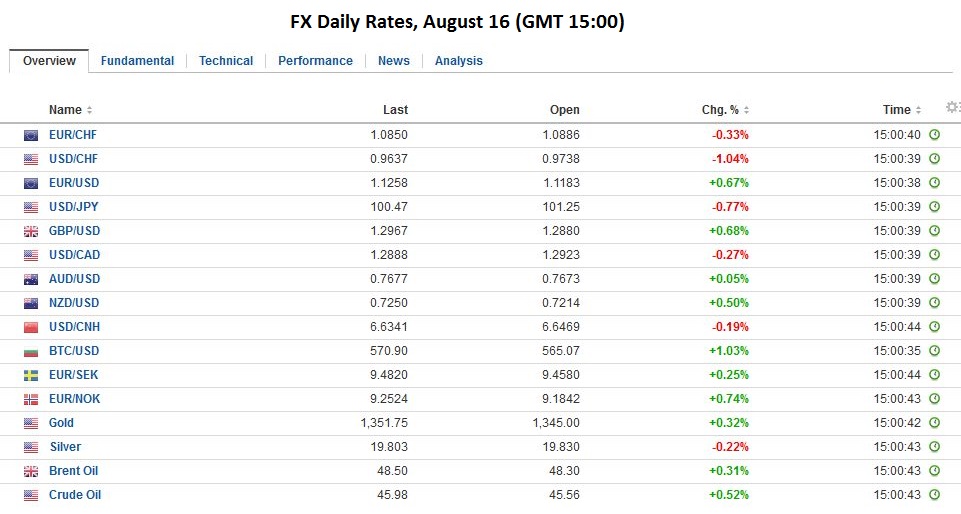
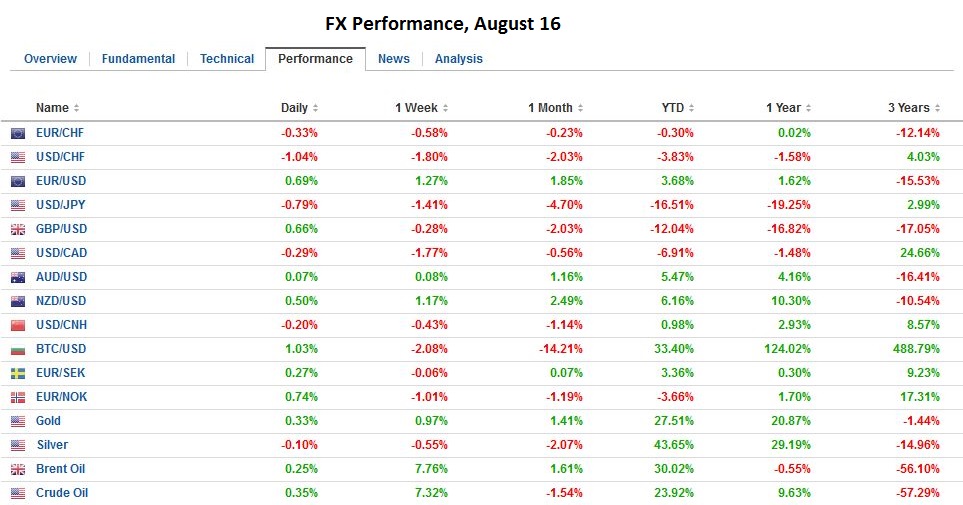
Swiss Franc Click to enlarge. FX Rates The US dollar is being sold across the board today. The US Dollar Index is off 0.65% late in the European morning, which, if sustained, would make it the largest drop in two weeks. The proximate cause being cited by participants and the media is weak US data that is prompting a Fed re-think. However, we are a bit skeptical. It is not that the US data has been strong, or that Fed officials have been touting the need to hike like many regional Fed Presidents did earlier this year. Rather our skepticism is based in the prices themselves. Begin with the widely cited Bloomberg calculation of the odds interpolated by the Fed funds futures strip. Presently, its calculations shows an 18% chance that Fed funds will be at 50-75 bp at the end of September, 20.7% in November and 37.9% in December. After the disappointing retail sales report at the end of last week, the probability was all lower at 16%, 17.5%, and 36.8% respectively. Moreover, on August 1, Bloomberg calculated the probability at 18%, 19.4%, and 31.5% respectively. This sampling does not suggest that the market’s expectations of Fed policy have changed much over the past fortnight, and to the extent, they have changed, the odds are a little greater not less.
Topics:
Marc Chandler considers the following as important: Bank of England, EUR, Featured, FX Daily, FX Trends, GBP, Germany ZEW Economic Sentiment, JPY, newsletter, U.K. Consumer Price Index, U.S. Consumer Price index, U.S. Dollar Index, U.S. Industrial Production, U.S. Treasuries, USD
This could be interesting, too:
Nachrichten Ticker - www.finanzen.ch writes Die Performance der Kryptowährungen in KW 9: Das hat sich bei Bitcoin, Ether & Co. getan
Nachrichten Ticker - www.finanzen.ch writes Wer verbirgt sich hinter der Ethereum-Technologie?
Martin Hartmann writes Eine Analyse nach den Lehren von Milton Friedman
Marc Chandler writes March 2025 Monthly
Swiss Franc |
|
FX RatesThe US dollar is being sold across the board today. The US Dollar Index is off 0.65% late in the European morning, which, if sustained, would make it the largest drop in two weeks. The proximate cause being cited by participants and the media is weak US data that is prompting a Fed re-think. However, we are a bit skeptical. It is not that the US data has been strong, or that Fed officials have been touting the need to hike like many regional Fed Presidents did earlier this year. Rather our skepticism is based in the prices themselves. Begin with the widely cited Bloomberg calculation of the odds interpolated by the Fed funds futures strip. Presently, its calculations shows an 18% chance that Fed funds will be at 50-75 bp at the end of September, 20.7% in November and 37.9% in December. After the disappointing retail sales report at the end of last week, the probability was all lower at 16%, 17.5%, and 36.8% respectively. Moreover, on August 1, Bloomberg calculated the probability at 18%, 19.4%, and 31.5% respectively. This sampling does not suggest that the market’s expectations of Fed policy have changed much over the past fortnight, and to the extent, they have changed, the odds are a little greater not less. The performance of the US two-year note also suggests that, if anything, the market has moved in the opposite direction of the narrative widely offered. The two-year note is yielding 70 bp, the same as at the end of last week and two basis points higher than on August 1. |
|
| So if shifting views on Fed policy does not seem like the most likely explanation, is there a better one? First, we note that the US dollar technical condition seems vulnerable to us (Dollar’s Downside Beckons in the Week Ahead). Second, a fundamental case may be found with the $37.45 bln coupon payment that the US Treasury makes this month and the $54.56 bln in bond maturities. That is $92 bln of capital looking for a home. The new issuance of $62 bln in securities absorbs nearly two-thirds of it. That still leaves $30 bln to be invested. Due to the cost of hedging new US-dollar denominated investments, the hypothesis is that a chunk of this money is being repatriated or invested in other higher yielding bond markets, with Japan, a key player.
The dollar has approached JPY100. This is in important psychological area, though the Brexit low was almost JPY99.00. The lowest close was on July 8 near JPY100.55. The JPY100 level also may be a neckline to a possible head and shoulder pattern, which could be an unusual but not unprecedented continuation pattern rather than a more traditional reversal pattern.The pattern is about JPY7.5, which translates into a measuring objective of near JPY92.50 if the neckline is successfully violated.
|
|
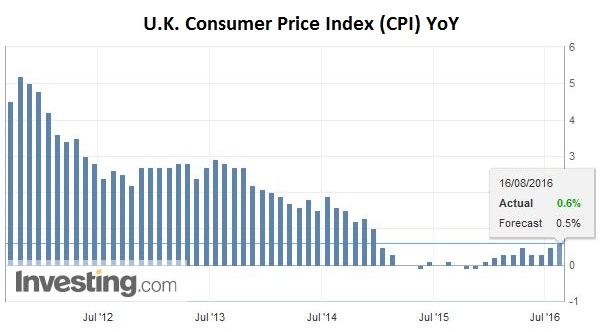
United KingdomThe heavy US dollar tone offers sterling some reprieve. Yesterday, it finished the North American session at its lowest level in more than 30 years (~$1.2880). Despite today’s recovery, it has been unable to resurface above previous support around $1.30. The July inflation report had been cited as the first “hard data” since the referendum, but the impact of sterling’s sharp drop is barely detectable. Consumer prices slipped 0.1% on the month, while the year-over-year pace quickened to 0.6% from 0.5%. The core rate eased to 1.3% from 1.4%. That said, import prices did surge. The 6.5% annualized pace is the most since the end of 2011. To be sure, the Bank of England expect the decline in sterling to boost measured inflation. However, it recognizes it as a transitory phenomenon. Policymakers want to look through it. The prospect of currency-induced price pressures (as opposed to, say, capacity constraints) has not and will not prevent the BOE from easing policy. Sterling’s weakness and the decline in interest rates help cushion the economic shock for the UK. |
 Click to enlarge. Source Investing.com |
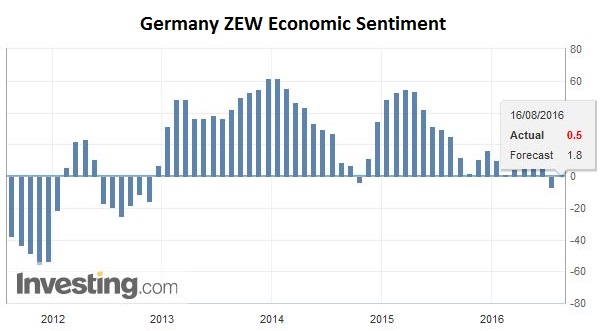
EurozoneThe euro is going for the ride. It has reached the 50% retracement objective of the decline since May 3’s brief push above $1.16 at $1.1265. The 61.8% retracement is found near $1.1350. The German ZEW, the main eurozone data today, was mixed. The assessment of current condition jumped to 57.6 from 49.8; well above expectations for 50.2. However, the forward-looking expectations component showed considerably less improvement than expected. The 0.5 reading is better than the -6.8 reported in July but poorer than the 2.0 expected. |
 Click to enlarge. Source Investing.com |
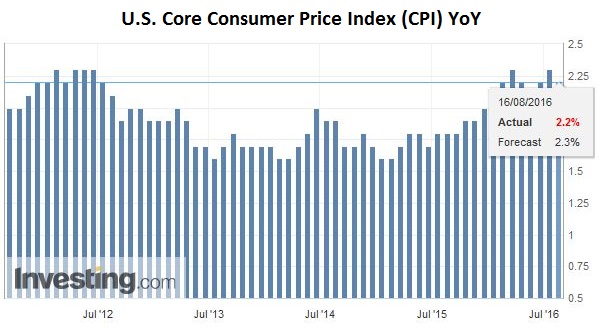
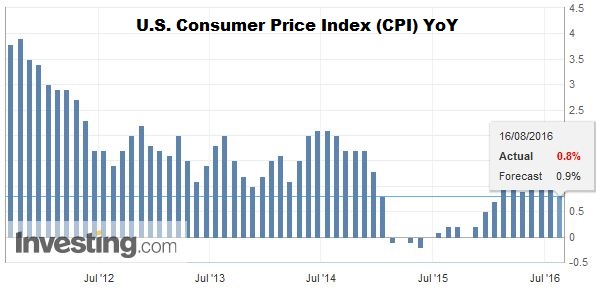
United StatesIn the US, three economic reports are featured: CPI, industrial and manufacturing output, and housing starts. Consumer prices are expected to be flat in July for a 0.9% year-over-year increase (from 1.0% in June). The core rate is expected to be steady at 2.3%. |
 Click to enlarge. Source Investing.com |
| If the median forecasts are in error, we suspect the risk is on the upside, perhaps due to medical service costs picked up in last week’s PPI report. |
 Click to enlarge. Source Investing.com |
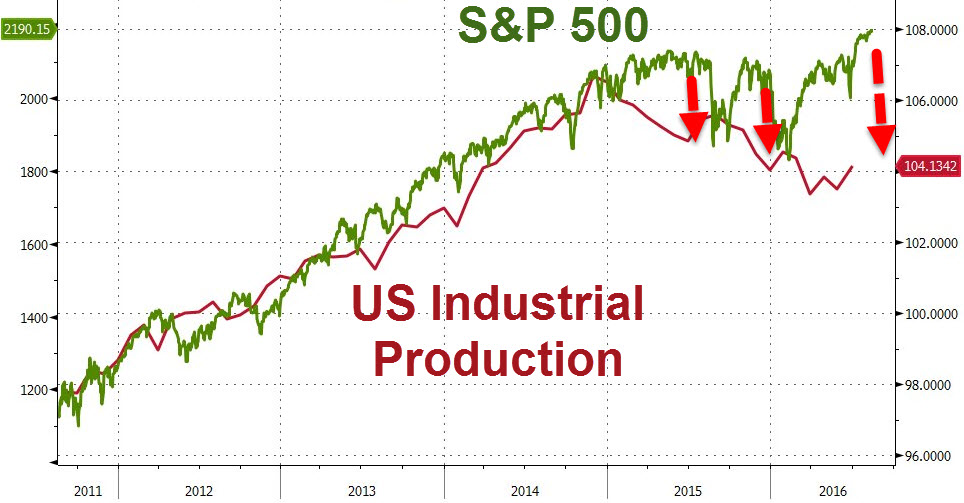
| Industrial and manufacturing output are expected to have increased, albeit at a slower pace than June. Industrial output is expected to have risen 0.3% after 0.6% in June (though we suspect the risk here is on the upside perhaps due to utility output).
Manufacturing production is expected to have risen by 0.3% after a 0.4% rise in June. If this is accurate, it would be the first time since March-April 2015 that manufacturing output rose two consecutive months. |
Graphs and additional information on Swiss Franc by the snbchf team.

