The prices of the metals dropped by 20 bucks and 20 pennies this week. In other words, the dollar went up ½ milligram gold or 30 mg silver. It wasn’t the euro, which ended the week unchanged. It wasn’t the US stock market, which ended up seven bucks. What was it? To answer this, we are reminded of a curious panel at the London Bullion Market Association conference a few weeks ago in Vienna. One of the panelists said “it’s hard to predict the price.” It seemed a lot like saying it’s hard to bend silverware by mind power. The panelists all agreed that the price of gold will fall, to like 0 or so. Readers know that we don’t see any such price in the data (and we don’t heed such predicts based on flawed methodology). Of course the fundamentals could change, but it’s no way to make predictions based on, “well things could change”. In the same vein, we will not opine as to what caused the noise in the prices of the metals this week. It could be a large holder placed an order to sell. It could be that, in the words of Jon Snow, “winter is coomin’” (traveling in the southern hemisphere at the moment, we are reminded to say summer is coming here in New Zealand!) What we do know is that the actions of buyers, and in this case sellers, leave their fingerprints on the market. Read on for the picture of supply and demand fingerprints… First, here is the graph of the metals’ prices.
Topics:
Keith Weiner considers the following as important: Complimentary SD Report, Monetary Metals
This could be interesting, too:
Keith Weiner writes Paper Gold Is Rising
Bill Bonner writes Why Janet Yellen Can Never Normalize Interest Rates
Pater Tenebrarum writes Frisky Yen Upsets Japan’s GOSPLAN
Bill Bonner writes Going Into Debt to Invest Into Debt…
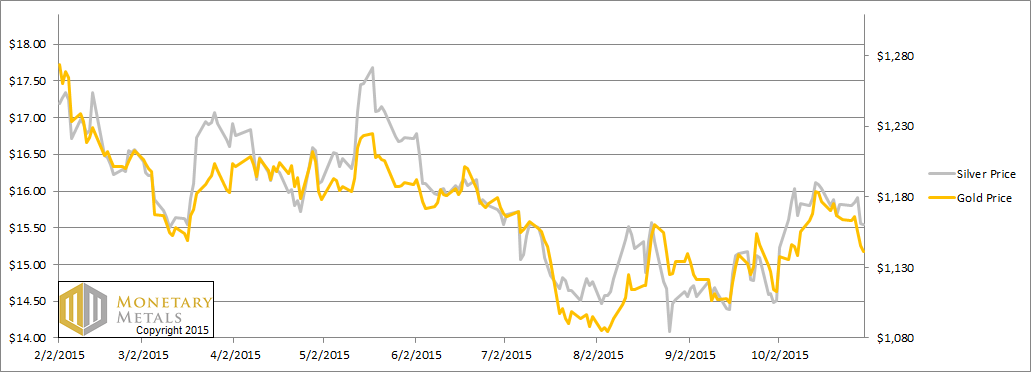
The prices of the metals dropped by 20 bucks and 20 pennies this week. In other words, the dollar went up ½ milligram gold or 30 mg silver. It wasn’t the euro, which ended the week unchanged. It wasn’t the US stock market, which ended up seven bucks.
What was it?
To answer this, we are reminded of a curious panel at the London Bullion Market Association conference a few weeks ago in Vienna. One of the panelists said “it’s hard to predict the price.” It seemed a lot like saying it’s hard to bend silverware by mind power. The panelists all agreed that the price of gold will fall, to like $800 or so. Readers know that we don’t see any such price in the data (and we don’t heed such predicts based on flawed methodology). Of course the fundamentals could change, but it’s no way to make predictions based on, “well things could change”.
In the same vein, we will not opine as to what caused the noise in the prices of the metals this week. It could be a large holder placed an order to sell. It could be that, in the words of Jon Snow, “winter is coomin’” (traveling in the southern hemisphere at the moment, we are reminded to say summer is coming here in New Zealand!)
What we do know is that the actions of buyers, and in this case sellers, leave their fingerprints on the market.
Read on for the picture of supply and demand fingerprints…
First, here is the graph of the metals’ prices.
We are interested in the changing equilibrium created when some market participants are accumulating hoards and others are dishoarding. Of course, what makes it exciting is that speculators can (temporarily) exaggerate or fight against the trend. The speculators are often acting on rumors, technical analysis, or partial data about flows into or out of one corner of the market. That kind of information can’t tell them whether the globe, on net, is hoarding or dishoarding.
One could point out that gold does not, on net, go into or out of anything. Yes, that is true. But it can come out of hoards and into carry trades. That is what we study. The gold basis tells us about this dynamic.
Conventional techniques for analyzing supply and demand are inapplicable to gold and silver, because the monetary metals have such high inventories. In normal commodities, inventories divided by annual production (stocks to flows) can be measured in months. The world just does not keep much inventory in wheat or oil.
With gold and silver, stocks to flows is measured in decades. Every ounce of those massive stockpiles is potential supply. Everyone on the planet is potential demand. At the right price, and under the right conditions. Looking at incremental changes in mine output or electronic manufacturing is not helpful to predict the future prices of the metals. For an introduction and guide to our concepts and theory, click here.
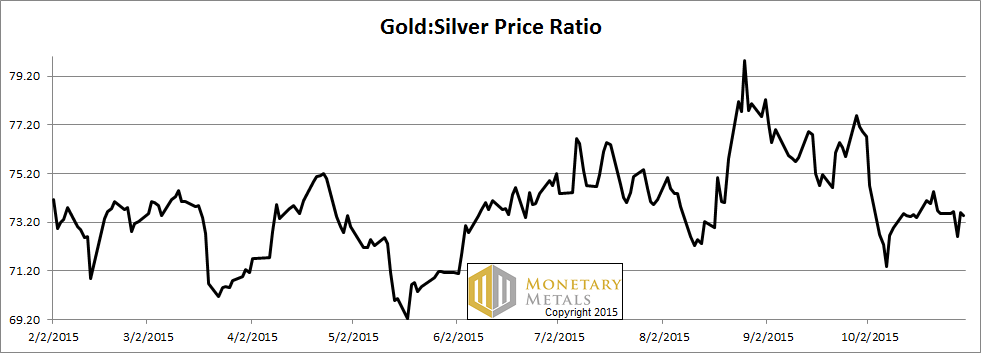
Next, this is a graph of the gold price measured in silver, otherwise known as the gold to silver ratio. The ratio barely budged this week.
The Ratio of the Gold Price to the Silver Price
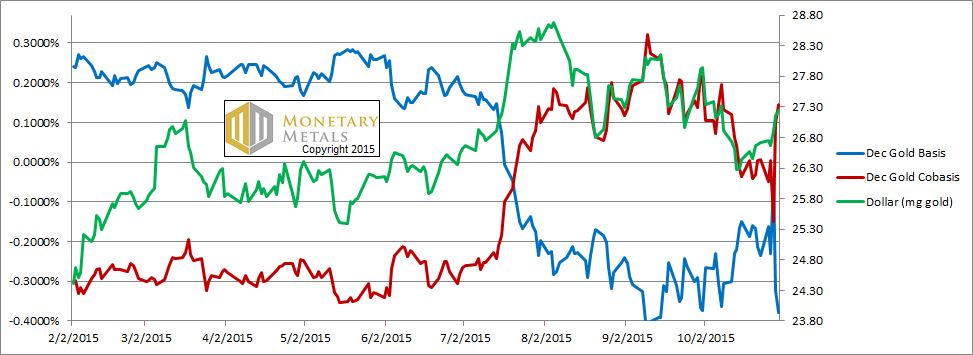
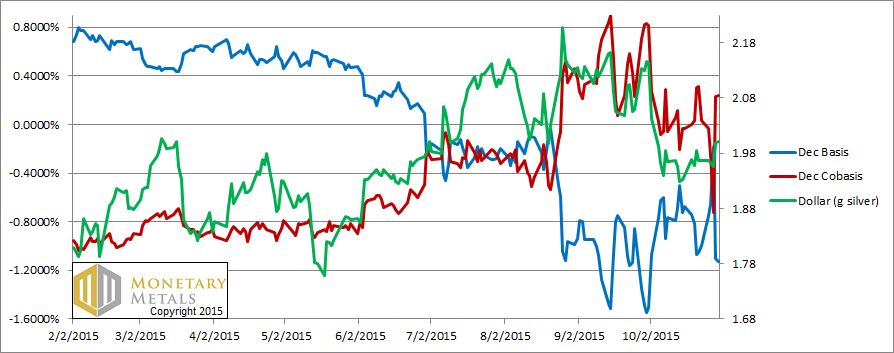
For each metal, we will look at a graph of the basis and cobasis overlaid with the price of the dollar in terms of the respective metal. It will make it easier to provide brief commentary. The dollar will be represented in green, the basis in blue and cobasis in red.
Here is the gold graph.
The Gold Basis and Cobasis and the Dollar Price
The scarcity of gold tracks still the price of the dollar in gold. You may be wondering what the heck happened on Wednesday 28 Oct. The scarcity (i.e. cobasis) dropped and the abundance (i.e. basis) spiked. The price of gold was $1180 for a while that day. It didn’t close at that price, it dropped but that was late in the day. So the abundance and scarcity are tracking the price more closely than the deviation that day would seem to indicate.
Our calculated fundamental price was flat on the week, about $1160.
Now let’s look at silver.
The Silver Basis and Cobasis and the Dollar Price
The same intraday price anomaly occurred in silver.
Unfortunately, for silver speculators (we reserve the word investment for buying an asset with the expectation of earning a yield, for financing something productive), the December data paints a more bullish picture than data from farther months. Both metals have a tendency for contracts to slip into backwardation as they near expiry. Silver does it in a bigger way than gold, perhaps because central banks can’t lease silver to smooth out volatility as they can with gold.
To put it in perspective, the Dec 2016 gold basis has been crushed down to +28 basis points (i.e. 0.28%). The silver basis for that same month is comparatively large +78 bps (both of which are highly affected by our zero interest rate environment).
Silver is simply more abundant than gold. Call it the industrial side of silver being weak, whatever you will. That is the fact.
We calculate a fundamental price for silver well over half a buck below the market price. This is where we got the headline for this Report. The fundamental price is well under $15.
Keith is helping put together a series of Monetary Innovation Conferences. The first two are in DC on Nov 13, and Phoenix on Nov 17. This is not just for the right wing, but for everyone from the unbanked to Wall Street. At the conference, speakers will discuss gold and how innovators are using it to solve real problems for real people. Please click here to register. After the conference, we may put on a Monetary Metals seminar if there is sufficient interest. Please click here if interested (different link).
© 2015 Monetary Metals

