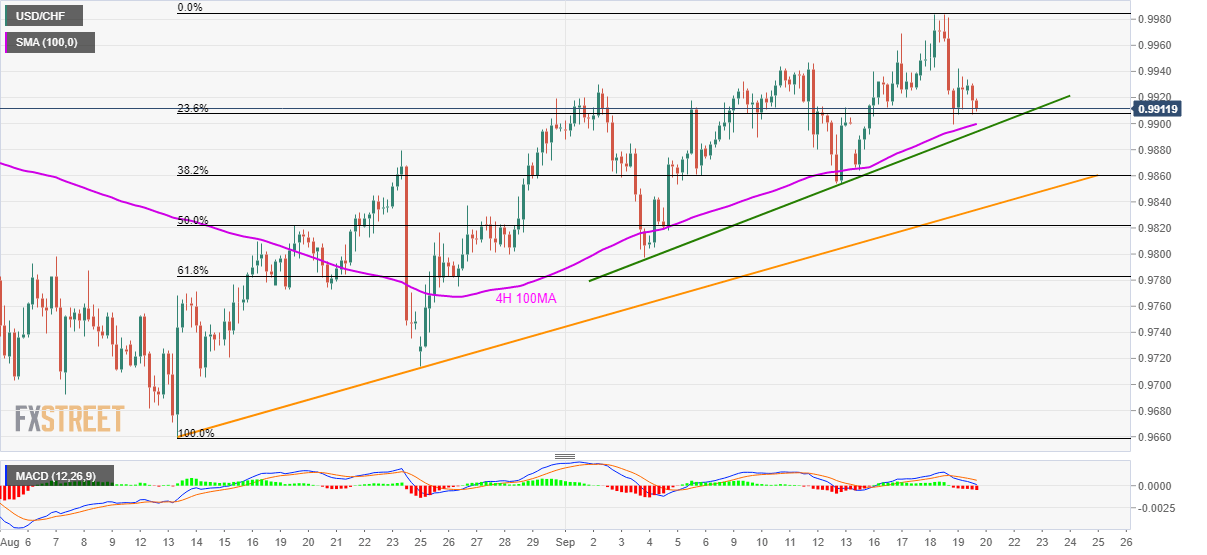
USD/CHF extends Thursday’s downpour, nears short-term key supports. An upside break of 0.9985 could recall June month highs. Given the failure to rise past-0.9980/85 area, USD/CHF carries the previous day’s declines while trading around 0.9913 ahead of the Europe markets open on Friday. The bearish signal from 12-bar moving average convergence and divergence (MACD) indicates brighter chances of pair’s further declines to 100-bar moving average on the four-hour chart, at 0.9900 now, followed by a two-week-old rising trend-line near 0.9890. Should sellers refrain from respecting immediate support-line, 38.2% Fibonacci retracement of August-September upside, at 0.9860, and a month-long ascending trend-line close to 0.9835 will be on the bears’ radar. Alternatively,
Topics:
Anil Panchal considers the following as important: 4.) FXStreet, 4) FX Trends, Featured, newsletter, USD/CHF
This could be interesting, too:
Nachrichten Ticker - www.finanzen.ch writes Die Performance der Kryptowährungen in KW 9: Das hat sich bei Bitcoin, Ether & Co. getan
Nachrichten Ticker - www.finanzen.ch writes Wer verbirgt sich hinter der Ethereum-Technologie?
Martin Hartmann writes Eine Analyse nach den Lehren von Milton Friedman
Marc Chandler writes March 2025 Monthly
- USD/CHF extends Thursday’s downpour, nears short-term key supports.
- An upside break of 0.9985 could recall June month highs.
| Given the failure to rise past-0.9980/85 area, USD/CHF carries the previous day’s declines while trading around 0.9913 ahead of the Europe markets open on Friday.
The bearish signal from 12-bar moving average convergence and divergence (MACD) indicates brighter chances of pair’s further declines to 100-bar moving average on the four-hour chart, at 0.9900 now, followed by a two-week-old rising trend-line near 0.9890. Should sellers refrain from respecting immediate support-line, 38.2% Fibonacci retracement of August-September upside, at 0.9860, and a month-long ascending trend-line close to 0.9835 will be on the bears’ radar. Alternatively, 0.9950 and 0.9980/85 holds the key to pair’s rally towards early-June tops surrounding 1.0020, adjacent to mid-May bottoms nearing 1.0050. |
USD/CHF 4-hour chart, August-September 2019(see more posts on USD/CHF, ) |
Trend: pullback expected
Tags: Featured,newsletter,USD/CHF

