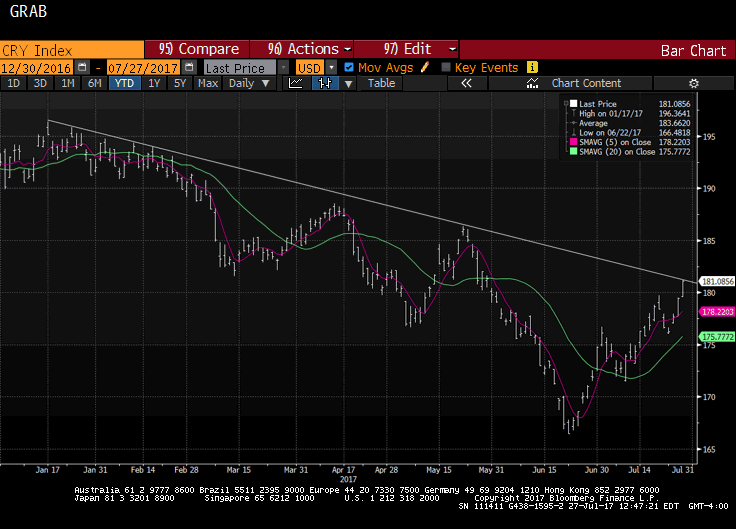
The CRB Index gapped higher today and it follows a gap higher opening on Tuesday, which has not been filled. Today’s gains lift the commodity index to a trendline drawn off the January and February highs and catches the high from late May. It intersects today near 181.35 and the high has been a little over 181.17. This is depicted on the Great Graphic made on Bloomberg, with five and 20-day moving averages added. Today’s advance it being led by cocoa (5.2%), orange juice (2.2%), gasoline (1.5%) and sugar (1.45%). Today’s 0.8% rise in the CRB index appears to be a function of breadth, as nearly all the individual commodities are higher (except lean hogs and live cattle) even if gains a modest. The softs are up nearly
Topics:
Marc Chandler considers the following as important: commodities, Featured, FX Trends, Great Graphic, newsletter
This could be interesting, too:
Nachrichten Ticker - www.finanzen.ch writes Die Performance der Kryptowährungen in KW 9: Das hat sich bei Bitcoin, Ether & Co. getan
Nachrichten Ticker - www.finanzen.ch writes Wer verbirgt sich hinter der Ethereum-Technologie?
Martin Hartmann writes Eine Analyse nach den Lehren von Milton Friedman
Marc Chandler writes March 2025 Monthly
| The CRB Index gapped higher today and it follows a gap higher opening on Tuesday, which has not been filled. Today’s gains lift the commodity index to a trendline drawn off the January and February highs and catches the high from late May. It intersects today near 181.35 and the high has been a little over 181.17. This is depicted on the Great Graphic made on Bloomberg, with five and 20-day moving averages added.
Today’s advance it being led by cocoa (5.2%), orange juice (2.2%), gasoline (1.5%) and sugar (1.45%). Today’s 0.8% rise in the CRB index appears to be a function of breadth, as nearly all the individual commodities are higher (except lean hogs and live cattle) even if gains a modest. The softs are up nearly 2% and the energy complex is up 1%. It is widely thought that the weaker dollar boosts commodity prices as many are traded and priced in US dollars. However, the correlation with the dollar is not particular robust or stable. There are, of course different ways to measure the dollar. Looking for simply directional sensitivity, we conducted the correlations on the level of the CRB and the level of the Dollar Index. On a 60-day rolling basis, the correlation has ranged from about 0.3 to -0.55. It presently is near -0.2. The euro-dollar is positive correlated with the CRB, though the 60-day rolling correlation dipped into negative territory twice in H2 16 and twice in H1 17. It is at 0.15 now, having ranged between 0.50 and -0.3, which as it turns out is near the correlation of the yen. The correlation between dollar-yen and the CRB has ranged between 0.5 and -0.2 over the past two years (on a 60-day rolling basis). It is not at a statistically insignificant -0.06. The technical indicators suggest that while the CRB can advance toward the May high near 186.35, stronger gains may be difficult without consolidation/correction. The Slow Stochastic is already rolling over. |
CRB Index |
Tags: commodities,Featured,Great Graphic,newsletter

