On Thursday May 12, the price of silver fell about a buck. As with every one of these big price moves, the question is: what really happened? Below is a chart of the day’s action, with price overlaid with basis. Basis = future – spot. It is a great (i.e. the only) indicator of abundance or scarcity of metal to the market. However, here we are using it for a different, simpler purpose. We want to see the relative moves in the spot price and the near futures contract price (i.e. July). The day was mixed. Before noon (times are GMT), the basis is volatile but tends to fall with the falling price. The basis drops from around -1.1% to -1.5%. But after noon, something changed. We see falling price and rising basis. The basis tends to follow the shape of the price line,
Topics:
Keith Weiner considers the following as important: 6a.) Monetary Metals, 6a) Gold & Monetary Metals, Basic Reports, Featured, newsletter
This could be interesting, too:
Nachrichten Ticker - www.finanzen.ch writes Die Performance der Kryptowährungen in KW 9: Das hat sich bei Bitcoin, Ether & Co. getan
Nachrichten Ticker - www.finanzen.ch writes Wer verbirgt sich hinter der Ethereum-Technologie?
Martin Hartmann writes Eine Analyse nach den Lehren von Milton Friedman
Marc Chandler writes March 2025 Monthly
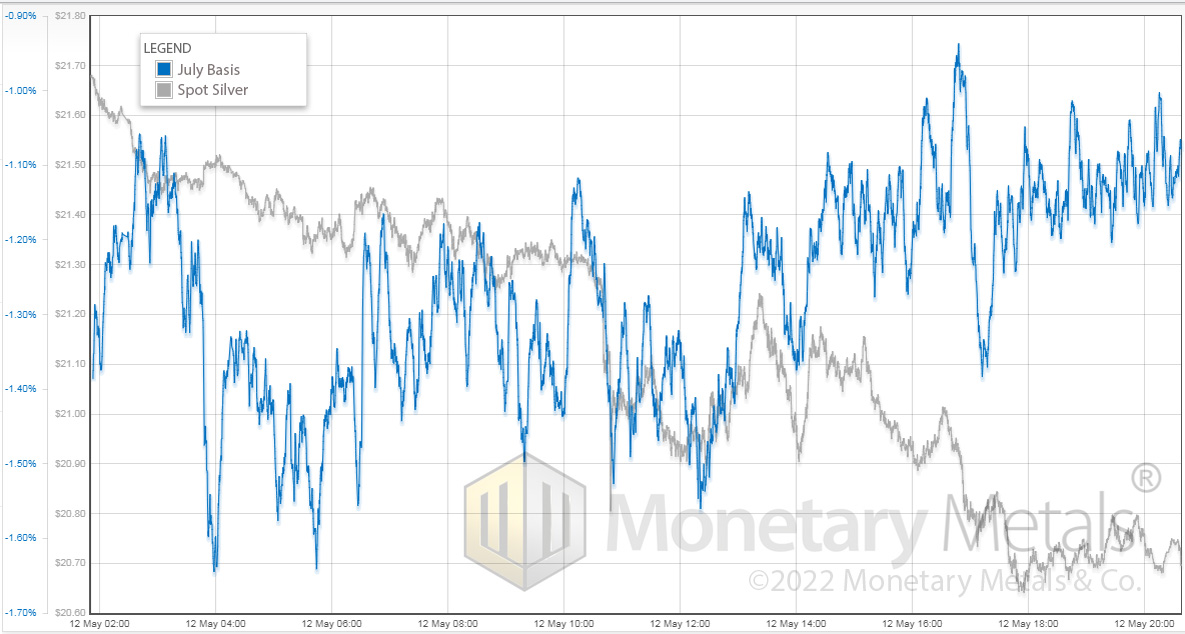
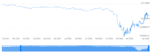
| On Thursday May 12, the price of silver fell about a buck. As with every one of these big price moves, the question is: what really happened? Below is a chart of the day’s action, with price overlaid with basis. Basis = future – spot. It is a great (i.e. the only) indicator of abundance or scarcity of metal to the market. However, here we are using it for a different, simpler purpose. We want to see the relative moves in the spot price and the near futures contract price (i.e. July).
The day was mixed. Before noon (times are GMT), the basis is volatile but tends to fall with the falling price. The basis drops from around -1.1% to -1.5%. But after noon, something changed. We see falling price and rising basis. The basis tends to follow the shape of the price line, but wends its way up as the price continues to fall. The day ends, with the basis at or above the level where it began, but the price is far below. |
 . |
The Basic Theory Behind the Market Complexity
There is a theory which is often touted in the precious metals community.
According to this theory, the banks sell futures to manipulate the price. That is, they do so without means or intent to deliver the metal. There’s lots we could say about this, but for today let’s focus on one thing.
The price of a futures contract did not move relative to the price of metal.
If the banks were dumping paper contracts, then the price of these contracts would move down relative to spot. As we see on this chart, that is not how the action went down on Thursday. The conspiracy mongers don’t want you to see this chart.
Markets are complex. There is not only a large number of participants, but also a large variety in the kinds of participants. It’s not “stackers vs. banksters”. That’s what makes it so fascinating to study them, and to trade when you can find a good setup.
Monetary Metals is Hiring! Click here to see our latest open position.
Make sure to subscribe to our YouTube Channel to check out all our Media Appearances, Podcast Episodes and more!
Additional Resources for Earning Interest on Gold
If you’d like to learn more about how to earn interest on gold with Monetary Metals, check out the following resources:
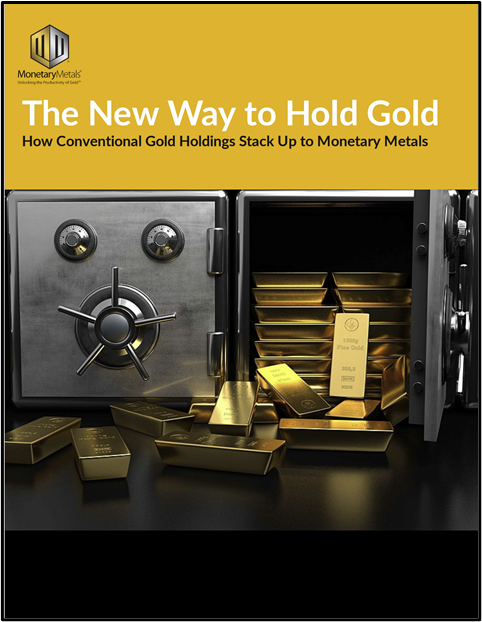
In this paper we look at how conventional gold holdings stack up to Monetary Metals Investments, which offer a Yield on Gold, Paid in Gold®. We compare retail coins, vault storage, the popular ETF – GLD, and mining stocks against Monetary Metals’ True Gold Leases.
The Case for Gold Yield in Investment Portfolios
Adding gold to a diversified portfolio of assets reduces volatility and increases returns. But how much and what about the ongoing costs? What changes when gold pays a yield? This paper answers those questions using data going back to 1972.
You Might Also Like
 Forensic Analysis of Fed Action on Silver Price
2022-05-09
The last few days of trading in silver have been a wild ride.
On Wednesday morning in New York, six hours before the Fed was to announce its interest rate hike, the price of silver began to drop. It went from around $22.65 to a low of $22.25 before recovering about 20 cents.
At 2pm (NY time), the Fed made the announcement. The price had already begun spiking higher for about two minutes.
As an aside, we wonder a bit about how they keep privileged traders from peeking at such announcements before the rest of the world gets to see it. If there was not central planning which ruled our fates with its every edict, this issue would not exist.
Anyways, the price moved up 23 cents by 2:05. It moved sideways waiting for the Fed press conference. Within 11 minutes of the start, the price was
 Time for a Silver Trade?
2022-05-04
The price of silver has been going down, and then down some more. From over $28 a year ago, and over $26.50 a month ago, it’s now at a new low under $22.50. Four bucks down in a month.
 Oil, the Ruble and Gold Walk into a Bar…Part III
2022-04-12
Part III – Gold Standards, the good, the bad, and the ugly. Gresham’s law and gold. Is it even possible to return to a gold standard today? Is Russia leading the push, or do we need something else?
 Oil, the Ruble, and Gold Walk into a Bar…
2022-04-05
Part I – Unpacking the narrative of how Russia is going to change the global monetary system. There is a Narrative about Russia and how it will change the monetary system. Many analysts in the gold community are promoting this story. There’s just one problem with this Narrative. It is like how Michael Crighton described the Gell-Mann Amnesia Effect, stating that the newspaper is full of stories explaining how “wet streets cause rain.”
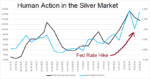 Human Action in the Silver Market
2022-03-29
We have recently seen an increase in social media posts about the big increase in short positions by the bullion banks. What would motivate them to short a commodity during this period of inflation, much less a monetary metal when central banks are printing money with reckless abandon? And doesn’t their shorting of silver push down the price?
 This is Not The Silver Breakout You’re Looking For!
2022-03-10
Every once in a while, one regrets not acting sooner, or not acting soon enough. In our case, we did not publish this Tuesday evening. We should have. Today the price is down, and others may also call for lower silver prices.
 Inflation and Gold: What Gives?
2021-12-21
Listen to the audio version of this article here! In the last Supply and Demand update, we discussed some different theories which attempt to explain what causes the gold and silver prices to move. We mentioned the: “…attempt to hold up a famous buyer of metal, while ignoring the thousands of not-famous sellers who sold the metal to said famous buyer.”
 What’s In Your Loan?
2021-11-23
“Real estate is the future of the monetary system,” declares a real estate bug. Does this make any sense? We would ask him this. “OK how will houses be borrowed and lent?” “Look at this housing bond,” he says, pointing to a bond denominated in dollars, with principal and interest paid in dollars.
Tags: Basic Reports,Featured,newsletter