Markets have struggled to find a clear direction as they attempt to digest US election news, debate performance, the impact of increased Covid-19 restrictions in many countries and vaccine news. The charts of gold and silver reflect the battle for dominance between the Bulls and the Bears. Today’s silver chart is a bit more crowded and busy than usual. Silver has continued to close just above the major trend line support from the March lows. It is also trading below both the 20 and 50 Day Moving Averages. A close below this trend line support could signal further short term weakness for the white metal with support coming in at the recent low closes around .75. A close below this and from a technical point of view we wouldn’t see much support above the .50
Topics:
Mark O'Byrne considers the following as important: 6a.) GoldCore, 6a) Gold & Bitcoin, Daily Market Update, Featured, newsletter
This could be interesting, too:
Nachrichten Ticker - www.finanzen.ch writes Die Performance der Kryptowährungen in KW 9: Das hat sich bei Bitcoin, Ether & Co. getan
Nachrichten Ticker - www.finanzen.ch writes Wer verbirgt sich hinter der Ethereum-Technologie?
Martin Hartmann writes Eine Analyse nach den Lehren von Milton Friedman
Marc Chandler writes March 2025 Monthly
| Markets have struggled to find a clear direction as they attempt to digest US election news, debate performance, the impact of increased Covid-19 restrictions in many countries and vaccine news.
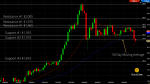
The charts of gold and silver reflect the battle for dominance between the Bulls and the Bears. Today’s silver chart is a bit more crowded and busy than usual. Silver has continued to close just above the major trend line support from the March lows. It is also trading below both the 20 and 50 Day Moving Averages. A close below this trend line support could signal further short term weakness for the white metal with support coming in at the recent low closes around $22.75. A close below this and from a technical point of view we wouldn’t see much support above the $19.50 support level which also happens to be where the 200 Day Moving Average is currently. On the upside a close above short-term resistance at $24.30 and higher again at $24.75 opens up the potential for another test of resistance at $26.50. |
Silver Chart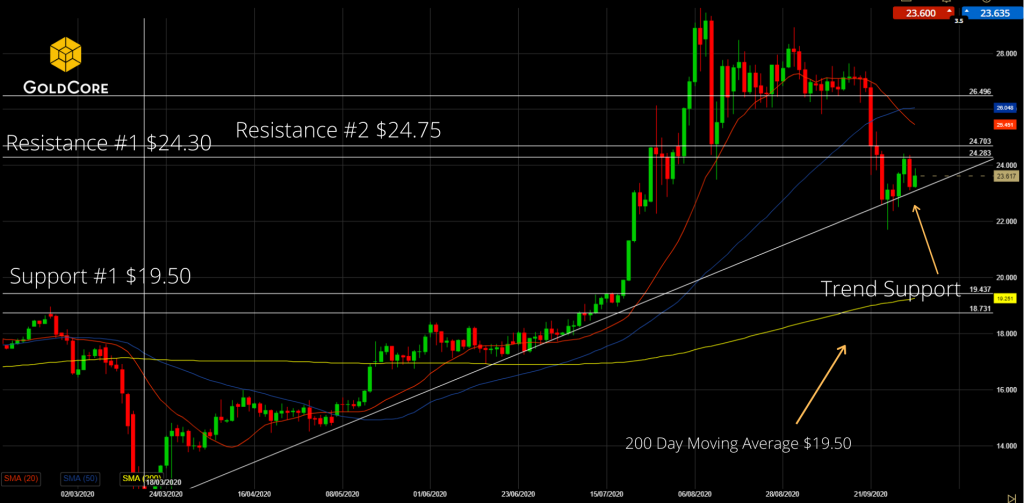 - Click to enlarge |
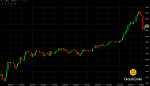
| Gold is currently testing resistance at $1,910 and continues to trade below the 20 Day Moving Average which is also proving to be resistance to an up move at the moment.
Further failure to close above either could signal another leg down and test of the significant support at $1,810, $1,750 or the 200 Day Moving Average at $1,722. On the upside a close ab$1,910 would be very bullish for gold short-term. Silver and in particular gold are taking their short-term directional signals from the stock market and the US dollar. Further sharp sell-offs in the stock markets and a rally in the dollar will weigh down the precious metals initially, as it always tends to. However, the arguments for holding gold and silver in this era of money printing and extreme financial, political and geo-political uncertainty have never been stronger. |
Gold Price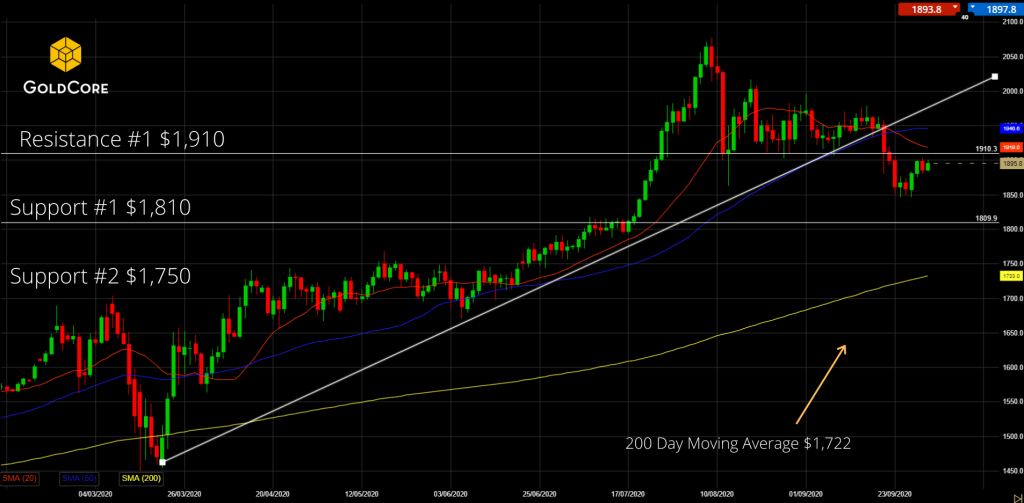 - Click to enlarge |
You Might Also Like
Source: Finiz.com
◆ Gold is the top performing asset in the world in the first half of 2020, outperforming all stock markets including the S&P 500 and the Nasdaq and outperforming “safe haven” U.S. government bonds (see table above).Gold had an 18% gain in dollars in the first half of 2020 as risk assets, especially stock markets, fell sharply with the S&P down 4.5% and other stock markets down more than 10% (see table). Gold gained 18.6% in euros and by 25% in British pounds as the UK economy had the worst contraction since 1979 and the pound was further devalued.
The historical data in the last 20 to 40 years shows that seasonally gold and silver tend to do poorly in June and very well in the summer months in July and August and extending into September. Indeed late June
 ‘Death Cross’ Strikes U.S. Dollar As Virus Cases Grow
A resurgent coronavirus pandemic in the United States and the prospect of improving growth abroad are souring some investors on the dollar, threatening a years-long rally in the currency.
Gold futures ended higher for a fifth straight session Thursday, with the most-active contract just short of notching a settlement record, highlighting feverish demand for bullion amid the worst pandemic in over a century.
 Gold Reaches $2,000/oz Prior to Two “Concerted Attacks” In Futures Market
The King Report“Anyone that’s been around the block a few times with gold knows that at some point ‘they’ will stage a concerted effort to drive gold lower.” December gold hit $2,000 at 21:19 ET Monday. It then retreated and traded sideways until 22:50 ET. Then someone slammed gold down to $1,955 in 20 minutes. This is obvious “impact trading.” Gold then traded sideways for over four hours.
 Perfect Storm for Precious Metals Leads to Price Correction
Gold fell by nearly 6% yesterday and silver by a whopping 15%, the largest one day loss in over 7 years. The futures market saw massive volumes of selling with over 1.6 bn ounces of silver contracts sold yesterday. That’s a value of over $40 billion.
 Value of gold stored by Irish metals broker GoldCore surges past €100m
Investment in gold has risen during pandemic. The value of gold coins and bars stored for clients by Irish precious metals broker GoldCore has surged 68pc so far this year to more than €100m.
The value of gold coins and bars stored for clients by Irish precious metals broker GoldCore has surged 68pc so far this year to more than €100m.
Gold prices last week topped the $2,000-per-ounce level for the first time as investors seek havens from the pandemic.
“We are seeing demand on a scale which has not been seen since the early stages of the global financial crisis in 2009 and we expect that to continue in the coming months,” said GoldCore CEO Stephen Flood.
NEWS and COMMENTARY
Gold loses ground as dollar firms; investors eye U.S. stimulusSilver rallies over 6%; Gold ends higher as China-U.S. tensions seen escalatingWhy Is Everyone Buying Gold?Yields hold near historic lows on economic slowdown fears
Dollar
 Gold is Looking Strong as it Tests Resistance
Since it’s sell-off from it’s early August high, gold has been stuck in an ever decreasing range. Having had a remarkable rally to an intra-day high of $2,078 on the 7th of August Gold has traded sideways and consolidated. This has been viewed by many market commentators as a healthy pause in gold’s bull rally as when markets go parabolic they tend to retrace just as fast.
 Heavy Metal Selling
Anxiety about an increase in Covid19 cases and fears of a second wave coupled with revelations of historic money laundering practices of major global banks weighed heavily on financial markets yesterday.
Tags: Daily Market Update,Featured,newsletter