USD/CHF is consolidating its losses this Thursday. The level to beat for bears is the 0.9855 support. USD/CHF daily chart On the daily chart, USD/CHF is trading in a range below its main daily simple moving averages (DSMAs). The market is approaching the October low, currently at the 0.9837 price level. USD/CHF daily chart(see more posts on USD/CHF, ) - Click to enlarge USD/CHF four-hour chart USD/CHF is under bearish pressure below its main SMAs as the market is nearing the 0.9855 support level. A break below this level can lead to an extension of the current bear leg towards the 0.9798 price level, according to the Technical Confluences Indicator. USD/CHF four-hour chart(see more posts on USD/CHF, ) - Click to enlarge USD/CHF 30-minute chart
Topics:
Flavio Tosti considers the following as important: 1.) FXStreet on SNB&CHF, 1) SNB and CHF, Featured, newsletter, USD/CHF
This could be interesting, too:
Nachrichten Ticker - www.finanzen.ch writes Die Performance der Kryptowährungen in KW 9: Das hat sich bei Bitcoin, Ether & Co. getan
Nachrichten Ticker - www.finanzen.ch writes Wer verbirgt sich hinter der Ethereum-Technologie?
Martin Hartmann writes Eine Analyse nach den Lehren von Milton Friedman
Marc Chandler writes March 2025 Monthly
USD/CHF daily chartOn the daily chart, USD/CHF is trading in a range below its main daily simple moving averages (DSMAs). The market is approaching the October low, currently at the 0.9837 price level. |
USD/CHF daily chart(see more posts on USD/CHF, )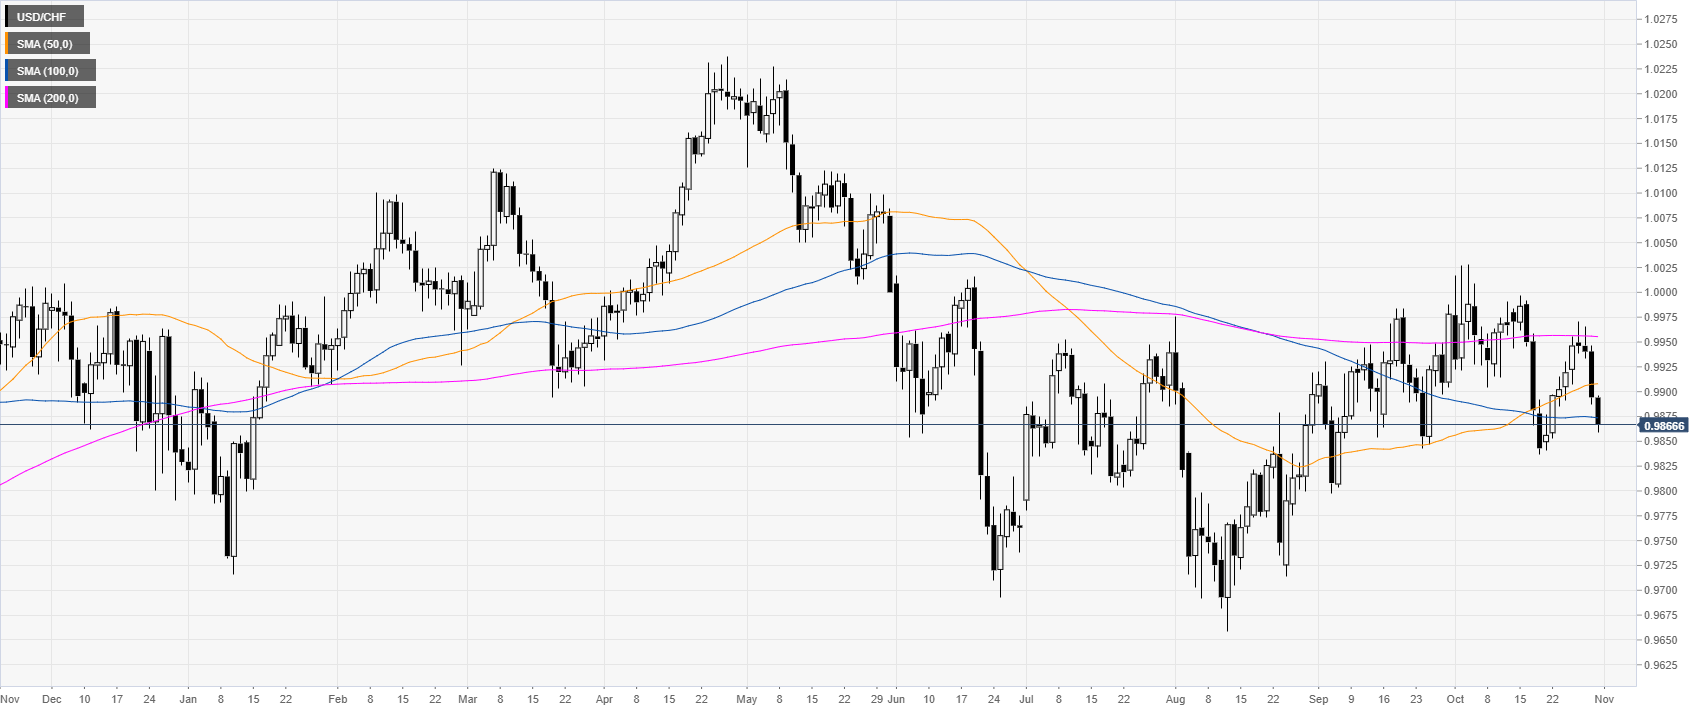 - Click to enlarge |
USD/CHF four-hour chartUSD/CHF is under bearish pressure below its main SMAs as the market is nearing the 0.9855 support level. A break below this level can lead to an extension of the current bear leg towards the 0.9798 price level, according to the Technical Confluences Indicator. |
USD/CHF four-hour chart(see more posts on USD/CHF, )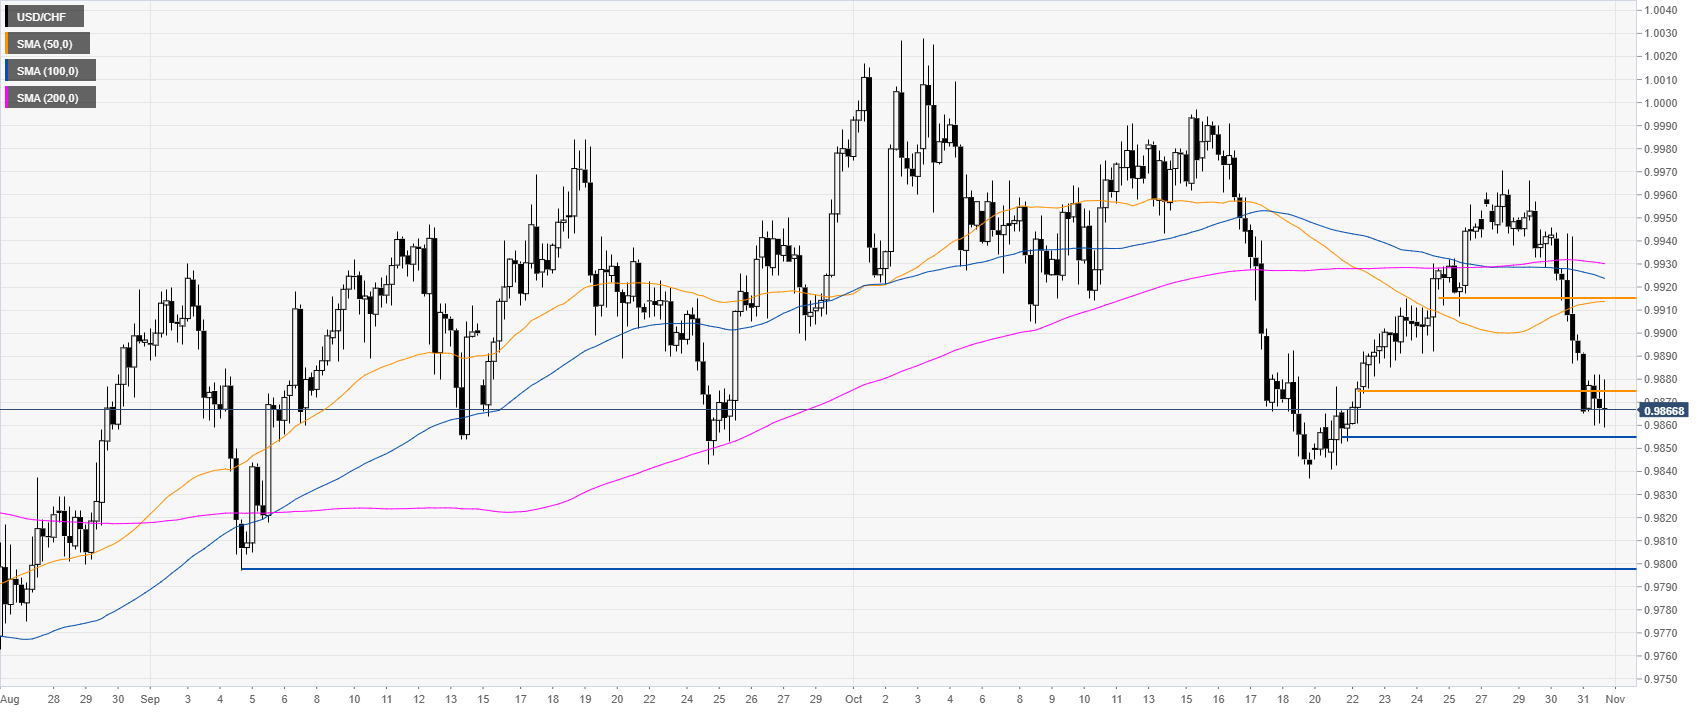 - Click to enlarge |
USD/CHF 30-minute chartUSD/CHF is trading below its main SMAs, suggesting a bearish bias in the near term. However, the market has been consolidation the recent losses this Thursday which is just a pause. Resistances can be seen at the 0.9875 and 0.9915 price levels, according to the Technical Confluences Indicator. |
USD/CHF 30-minute chart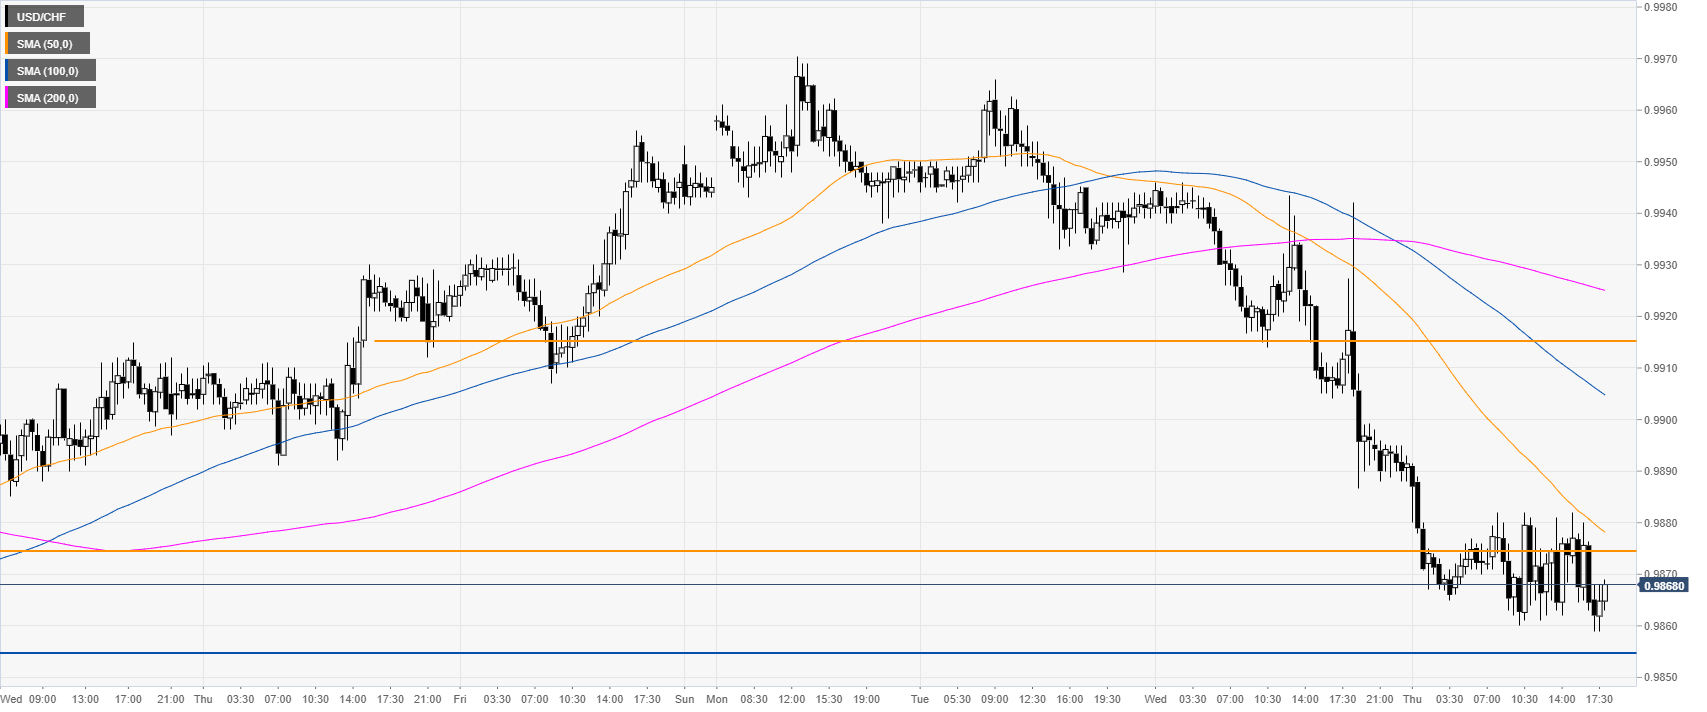 - Click to enlarge |
Tags: Featured,newsletter,USD/CHF