According to the Census Bureau, US companies have been importing foreign goods at a relentless pace. In estimates released last week, seasonally-adjusted US imports jumped to 4 billion in November 2017. That’s a record high finally surpassing the 0 billion mark for the first time, as well as the peaks for both 2014 and 2007. US Trade Balance, Jan 2014 - 2018(see more posts on U.S. Trade Balance, ) - Click to enlarge While that may be encouraging to some, there is ample to reason to believe it’s nothing more than another anomaly. For one, the Census Bureau estimates that US imports were flat and even contracting for most of 2017. From February through August, imports declined by just less than 2%. Then, out
Topics:
Jeffrey P. Snider considers the following as important: China, currencies, economy, exports, Featured, Federal Reserve/Monetary Policy, global trade, harvey, hurricane, imports, irma, Markets, newslettersent, Oil, oil prices, petroleum imports, The United States, U.S. Retail Sales, U.S. Trade Balance
This could be interesting, too:
Nachrichten Ticker - www.finanzen.ch writes Die Performance der Kryptowährungen in KW 9: Das hat sich bei Bitcoin, Ether & Co. getan
Nachrichten Ticker - www.finanzen.ch writes Wer verbirgt sich hinter der Ethereum-Technologie?
Marc Chandler writes March 2025 Monthly
Mark Thornton writes Is Amazon a Union-Busting Leviathan?
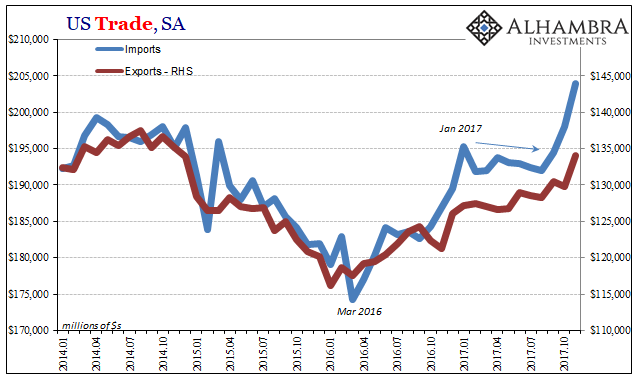
| According to the Census Bureau, US companies have been importing foreign goods at a relentless pace. In estimates released last week, seasonally-adjusted US imports jumped to $204 billion in November 2017. That’s a record high finally surpassing the $200 billion mark for the first time, as well as the peaks for both 2014 and 2007. |
US Trade Balance, Jan 2014 - 2018(see more posts on U.S. Trade Balance, ) |
| While that may be encouraging to some, there is ample to reason to believe it’s nothing more than another anomaly. For one, the Census Bureau estimates that US imports were flat and even contracting for most of 2017. From February through August, imports declined by just less than 2%.
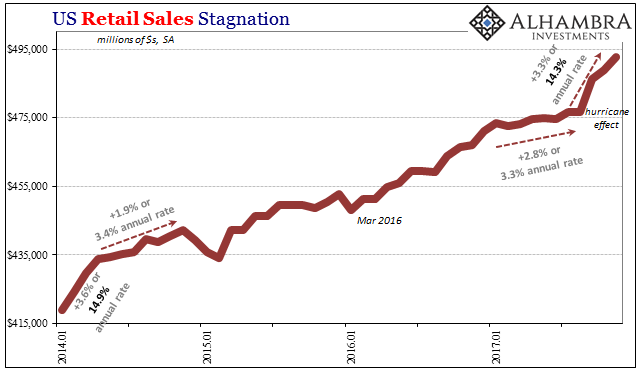
Then, out of nowhere, US demand in September absolutely gushed. In just those three months through November, US imports increased by 6.3%, an annual rate of just over 27%. The timing, as well as the pace, suggests our answer, hurricanes, just as it did for retail sales winding up the same pattern. |
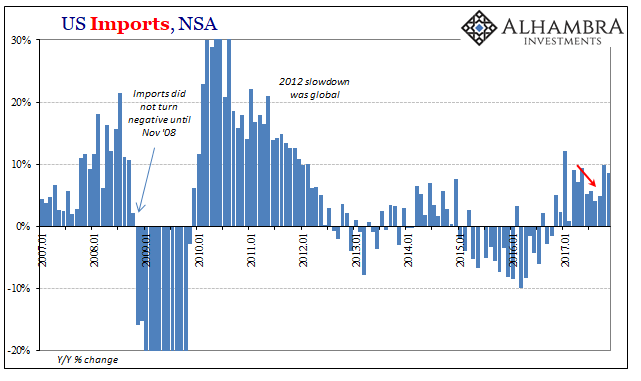
US Imports, Jan 2007 - 2018 |
| Unadjusted, imports rose by just 8.5% year-over-year, a level of expansion commiserate with the 2012 slowdown economy and nothing more. It was only slightly better than the 2014 upturn, but not meaningfully different from it.
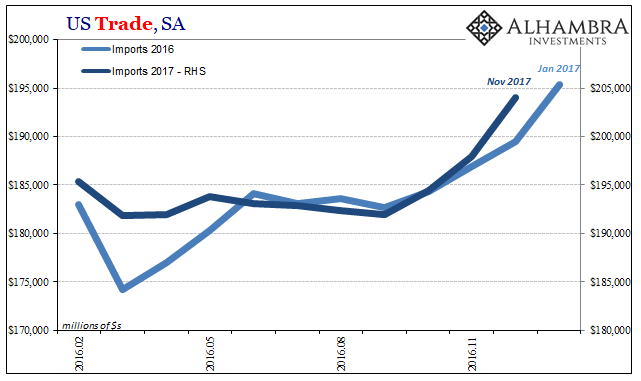
What’s interesting is that this is the second year in a row now where imports have jumped at the conclusion of the calendar year. In 2016, from November through January 2017 US imports spiked by a very similar 6.0% over those three months. The culprit then, unlike now, was obvious – WTI prices. |
US Trade Balance, Feb 2016 - Dec 2017(see more posts on U.S. Trade Balance, ) |
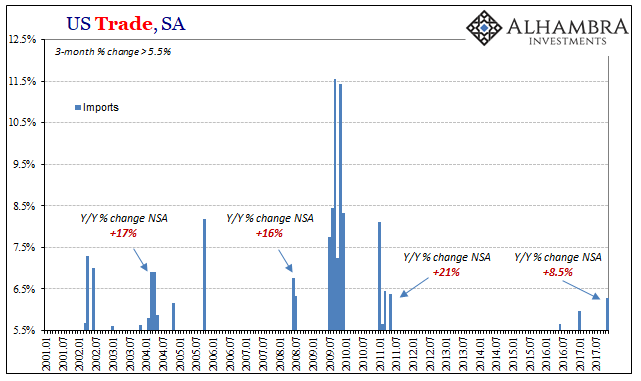
| Given the disparity of growth rates unadjusted, as well as the seemingly isolated occurrences in both cases, it does raise the issue of seasonality with regard to that particular series. A 6% 3-month increase has been exceedingly rare going back to 2011. It has happened, in fact, only in those two instances highlighted above. |
US Trade Balance, Jan 2001 - 2018(see more posts on U.S. Trade Balance, ) |
| More than that, however, a spike or acceleration in growth at that level isn’t often an exceptional circumstance like we’ve seen in both 2016 and 2017. In the past, a short burst of growth even to that high degree has been consistent with an overall upward trend varying only in its speed. The issue in 2017, by contrast, is a complete change from slight contraction to unbelievable growth.
That’s why the annual unadjusted growth rate is so much smaller this time from those in the past. |
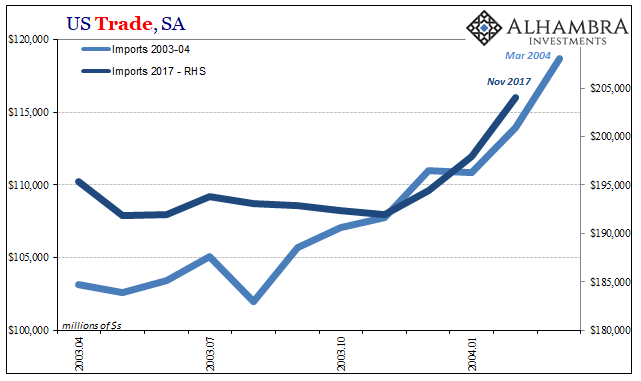
US Trade Balance, Apr 2003 - Dec 2017(see more posts on U.S. Trade Balance, ) |
| If 2016’s was due to oil then it appears very likely that 2017’s is the expected hurricane boost. Again, the concurrence of retail sales in almost exactly the same pattern is compelling – an obvious shift from recession-like growth to absolutely smashing all recent experience. |
US Retail Sales, Jan 2014 - 2018(see more posts on U.S. Retail Sales, ) |
| Looking further at the details of import growth during those three months suggests the same thing. |
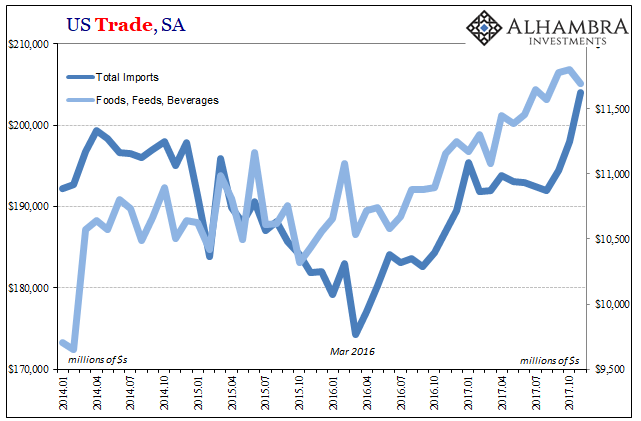
US Trade Balance, Jan 2014 - 2018(see more posts on U.S. Trade Balance, ) |
| First, the major components that didn’t change: |
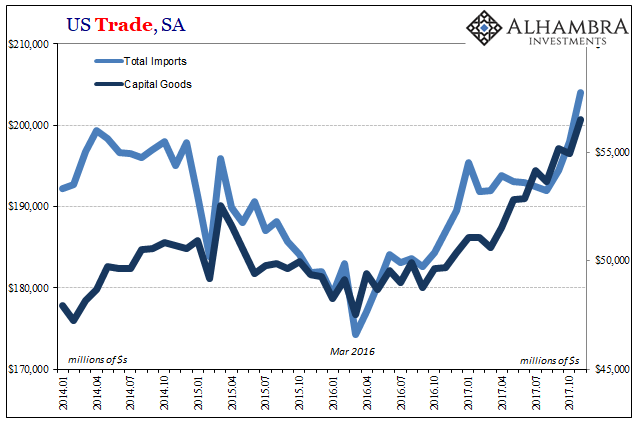
US Trade Balance, Jan 2014 - 2018(see more posts on U.S. Trade Balance, ) |
| Both the category for food imports as well as the one for inbound capital goods have been growing steadily since the trough in 2016. Since recent growth for each is pretty much in line with that trend, they aren’t responsible for the big shift the last three months.
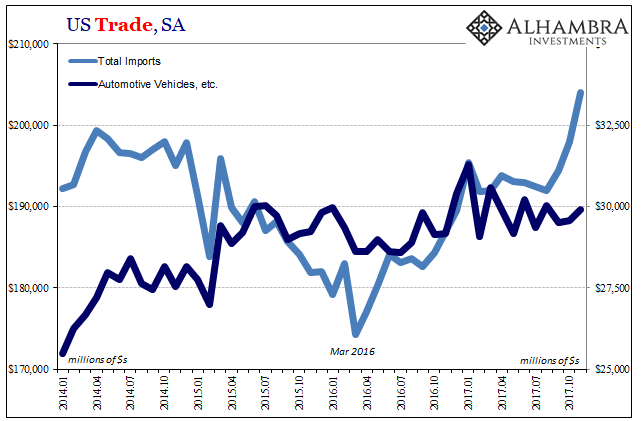
It might seem that if Harvey and Irma were a major factor for imports during that time, autos would be a primary candidate at those margins. Yet, imports of autos have stagnated for several years now, and show no changed after the tropical storms hit. |
US Trade Balance, Jan 2014 - 2018(see more posts on U.S. Trade Balance, ) |
| To me, that actually makes more sense in attributing import explosion to hurricane after-effects absent a similar or congruent jump in auto imports. The difference here is inventory, meaning that motor vehicle inventory as a result of lagging US sales had built up to such an extreme one anomaly (the destruction of perhaps hundreds of thousands of vehicles) wouldn’t lead to much if any change in the wider trend – even something as big as the flooded cars of Texas and Florida.
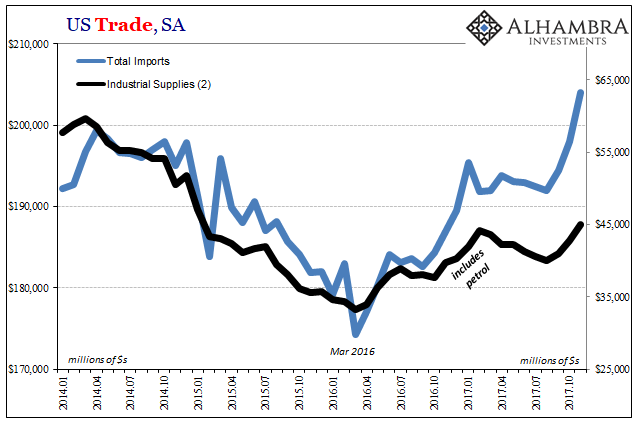
In other words, had auto imports jumped in the last three months I would have been more inclined to have viewed that as unrelated to Harvey and Irma, instead a shift in growth outlook beyond them in what would otherwise have meant a worldwide expectation for drawing down auto inventories in the US to such a degree over and above just the past three months. A more or less constant sideways trend auto imports tells us that US wholesalers and dealers are looking past the Gulf Coast problems to the underlying growth condition, which isn’t good. There appears to be far more than enough inventory to meet an influx of sales due to hurricane destruction. What has primarily been responsible for the changed in import growth the past three months falls into two categories. The first is familiar, the Industrial Supplies segment that includes petroleum (and petroleum prices). |
US Trade Balance, Jan 2014 - 2018(see more posts on U.S. Trade Balance, ) |
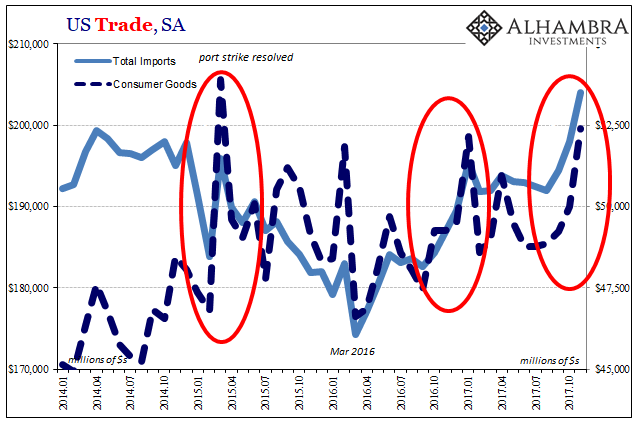
| The second is the clear correlation to retail sales in the form of Consumer Goods: |
US Trade Balance, Jan 2014 - 2018(see more posts on U.S. Trade Balance, ) |
| In fact, the rush for foreign consumer goods corresponds with more than just the latest one for overall imports. The rise at the end of 2016 was mostly attributable to petroleum but not entirely due to that one factor. Imports of consumer goods were up toward the end of last year, too, just as they were in early 2015 coincident to the resolution of the West Coast port strikes (and the one-month spike in imports, particularly from China, that followed).
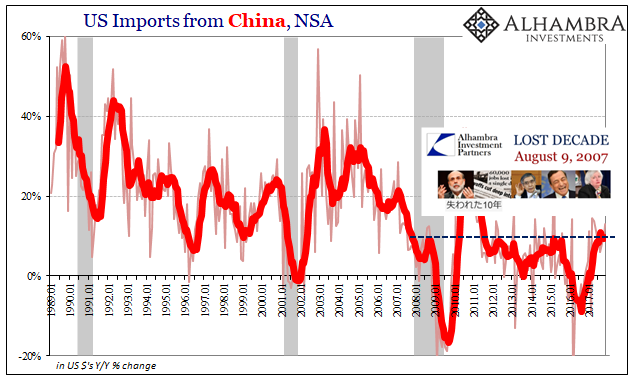
If we were seeing a meaningful shift in trend, it would have manifested far differently particularly in its overseas origins. We would expect that if US growth was at an upward inflection the Chinese would have been at the front of the line benefiting the most from it. Imports from China, however, continue to come in at a conspicuously low level. In November 2017, the dollar value of inbound Chinese goods was 13% more than the value in November 2016. As has been the case, 13% sounds terrific but is really unenthusiastic demand. It is perfectly inline with last year and the middle of this year when import growth was (in the seasonally-adjusted series) stagnant. It is perfectly in keeping with the upside limitation clearly evident post-crisis in departure from the precrisis global trade paradigm. |
US Imports from China, Jan 1989 - 2018 |
Given the way GDP is calculated, this jump in US demand for foreign goods for whatever may have been the reason should subtract a rather sturdy amount from Q4 growth. While the rest of the world should be relatively happy about an uptick in trade activity, that rebalancing should be perfectly in keeping with the same economic constraints in place going back ten years.
Good months or quarters have proven time and again to be the aberrations, and even then they are good only on a relative basis, both in terms of comparison and what is too much like a zero sum game. If this really has all been due to the hurricane boost, pity Q1 2018.
Tags: China,currencies,economy,exports,Featured,Federal Reserve/Monetary Policy,global trade,harvey,hurricane,imports,irma,Markets,newslettersent,OIL,oil prices,petroleum imports,U.S. Retail Sales,U.S. Trade Balance

