The Census Bureau reported today updated estimates for Durable Goods in July 2017. Quite frankly, nothing has changed so minimal commentary is all that is required. The aircraft anomaly from last month faded, leaving total new orders of 9.2 billion (seasonally-adjusted). That is less than in May before the Boeing surge, and less even than estimated order volume in March 2017. US Durable Goods Orders, Jul 1993 - 2017(see more posts on U.S. Durable Goods Orders, ) - Click to enlarge US Durable Goods Orders, Jan 1993 - 2017(see more posts on U.S. Durable Goods Orders, ) - Click to enlarge US Durable Goods Orders, Jan 2010 - Jul 2017(see more posts on U.S. Durable Goods Orders, ) - Click to
Topics:
Jeffrey P. Snider considers the following as important: capital goods, currencies, durable goods, economy, Featured, Federal Reserve/Monetary Policy, Markets, newsletter, The United States, U.S. Durable Goods Orders
This could be interesting, too:
Nachrichten Ticker - www.finanzen.ch writes Die Performance der Kryptowährungen in KW 9: Das hat sich bei Bitcoin, Ether & Co. getan
Nachrichten Ticker - www.finanzen.ch writes Wer verbirgt sich hinter der Ethereum-Technologie?
Martin Hartmann writes Eine Analyse nach den Lehren von Milton Friedman
Marc Chandler writes March 2025 Monthly
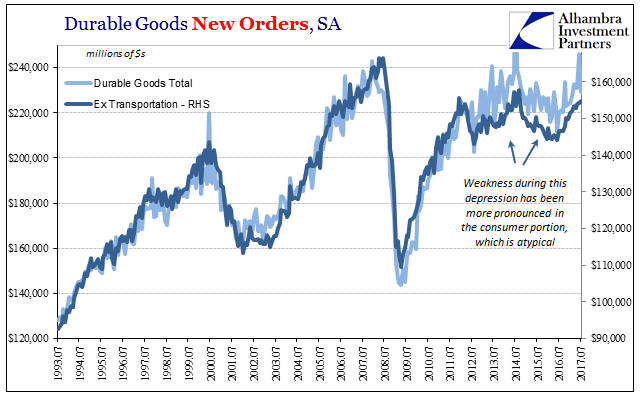
| The Census Bureau reported today updated estimates for Durable Goods in July 2017. Quite frankly, nothing has changed so minimal commentary is all that is required. The aircraft anomaly from last month faded, leaving total new orders of $229.2 billion (seasonally-adjusted). That is less than in May before the Boeing surge, and less even than estimated order volume in March 2017. |
US Durable Goods Orders, Jul 1993 - 2017(see more posts on U.S. Durable Goods Orders, ) |
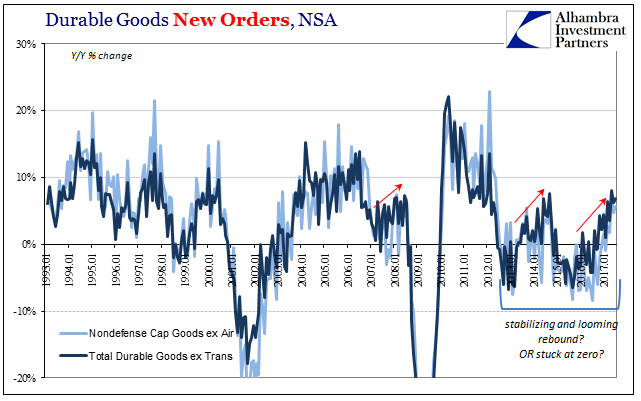
US Durable Goods Orders, Jan 1993 - 2017(see more posts on U.S. Durable Goods Orders, ) |
|
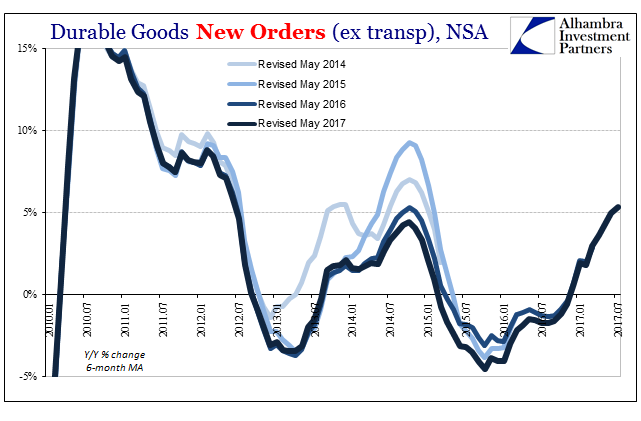
US Durable Goods Orders, Jan 2010 - Jul 2017(see more posts on U.S. Durable Goods Orders, ) |
|
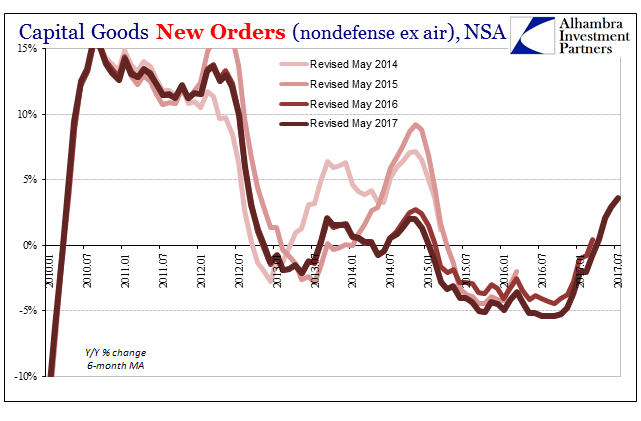
US Durable Goods Orders, Jan 2010 - Jul 2017(see more posts on U.S. Durable Goods Orders, ) |
|
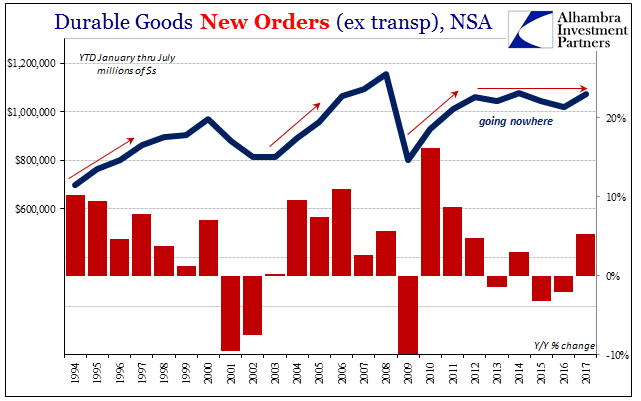
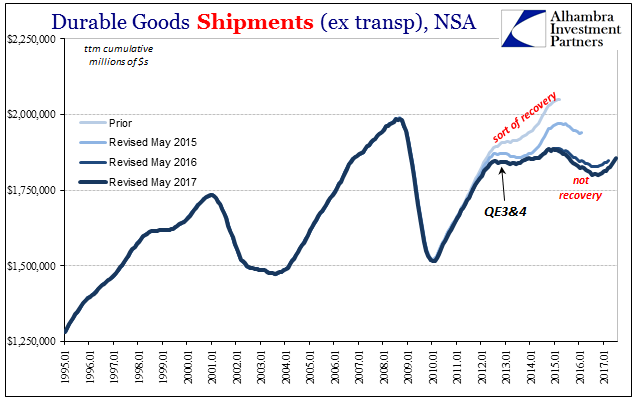
| Excluding transportation, new orders for durable goods rose at about the same rate as the past few months, +6.9% year-over-year (NSA). Shipments were up in similar fashion, +6.1%. These growth rates are insufficient to count as a rebound, as in both shipments and new orders, capital goods as well as durable goods overall, activity in this part of the manufacturing sector remains still less than at the prior peak ten years ago.
Nothing so far this year suggests that will change. Seasonally-adjusted, durable goods orders (ex transportation) rose to $154.8 billion in July. That’s still $11.6 billion less than in June 2008 nine years ago. Peak to peak that works out to an annual rate of -0.8% compounded “growth” for this “recovery.” |
US Durable Goods Orders, 1994 - 2017(see more posts on U.S. Durable Goods Orders, ) |
US Durable Goods Shipments, Jan 1995 - Jul 2017 |
Tags: capital goods,currencies,durable goods,economy,Featured,Federal Reserve/Monetary Policy,Markets,newsletter,U.S. Durable Goods Orders

