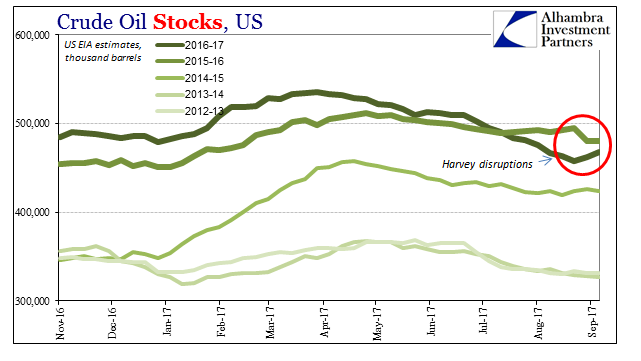
The impact of Hurricane Harvey on the Gulf energy region is becoming clear. There have been no surprises to date, even though the storm did considerable damage and shuttered or disrupted significant capacity. Most of that related to gasoline, which Americans have been feeling in pump prices. According to the US Department of Energy, as of August 31, 10 refineries had been shut down with a combined capacity of 3.01 million barrels per day (mpd). That is equal to about 32% of Gulf coast capability, and almost 17% of total national refining capacity. As a result, crude inventories have risen sharply the past two weeks (through last week). After falling to 457.8 million barrels before the storm, oil stocks gained about
Topics:
Jeffrey P. Snider considers the following as important: commodities, COT, Crude Oil, crude stocks, currencies, demand, economy, Featured, Federal Reserve/Monetary Policy, gasoline stocks, Markets, newslettersent, Oil, oil futures, oil prices, supply, The United States, WTI
This could be interesting, too:
Nachrichten Ticker - www.finanzen.ch writes Die Performance der Kryptowährungen in KW 9: Das hat sich bei Bitcoin, Ether & Co. getan
Nachrichten Ticker - www.finanzen.ch writes Wer verbirgt sich hinter der Ethereum-Technologie?
Marc Chandler writes March 2025 Monthly
Mark Thornton writes Is Amazon a Union-Busting Leviathan?
| The impact of Hurricane Harvey on the Gulf energy region is becoming clear. There have been no surprises to date, even though the storm did considerable damage and shuttered or disrupted significant capacity. Most of that related to gasoline, which Americans have been feeling in pump prices.
According to the US Department of Energy, as of August 31, 10 refineries had been shut down with a combined capacity of 3.01 million barrels per day (mpd). That is equal to about 32% of Gulf coast capability, and almost 17% of total national refining capacity. As a result, crude inventories have risen sharply the past two weeks (through last week). After falling to 457.8 million barrels before the storm, oil stocks gained about 10.4 million barrels despite 13.5% of Gulf crude production “shut in” (and 17.6% of nat gas production). |
US Crude Oil Stocks, Nov 2016 - Sep 2017(see more posts on Crude Oil, ) |
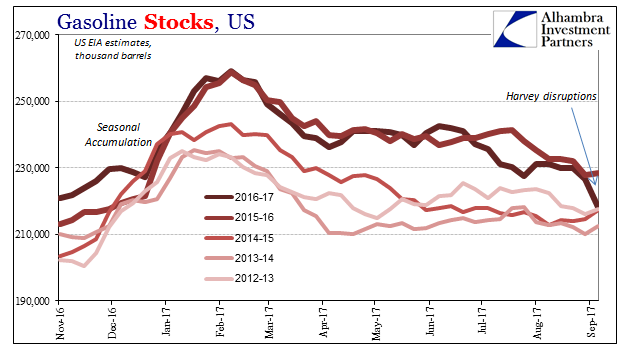
| With refiners offline, gasoline stocks plummeted by 11.6 million barrels to a level seasonally equivalent to 2015 and 2013 before the big pileup. |
US Gasoline Stocks, Nov 2016 - Sep 2017 |
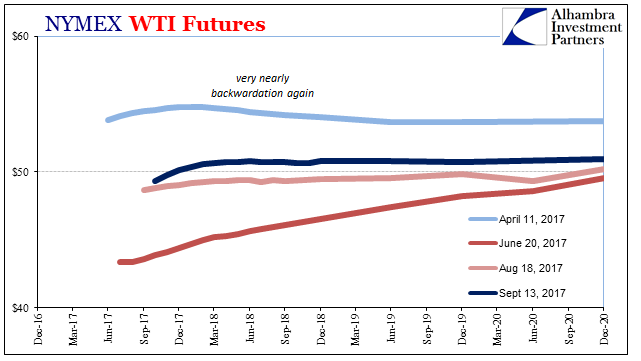
| Markets are taking this re-arrangement in stride. The WTI futures curve is slightly higher than before the storm, but generally steeper at the front end. It suggests the market isn’t viewing these changes as anything other than what they are – storm disruptions and bottlenecks. |
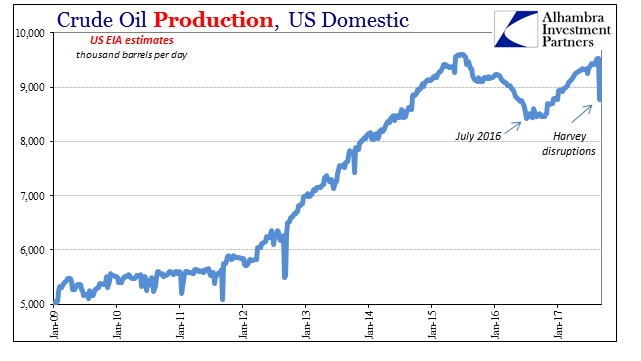
US Crude Oil Production, Jan 2009 - 2017(see more posts on Crude Oil, ) |
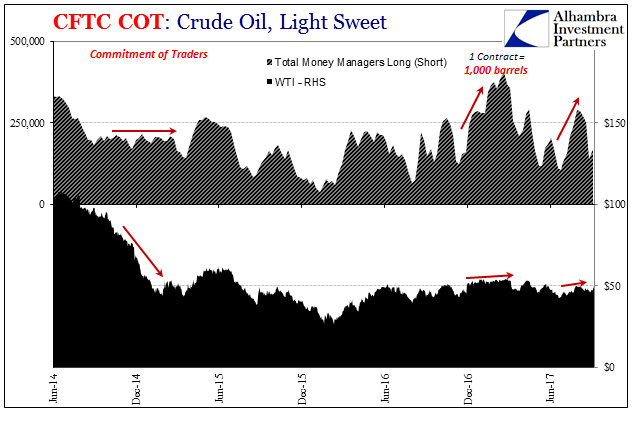
| As noted earlier in the week, the Commitment of Traders report showed less of a net long position among the market-setting money managers. Over these two weeks, managers became less net long by 82,620 contracts. The specs (Other) offset that change somewhat by increasing their net long by 19,285, while swap dealers and producers reduced their shorts by 17,629 and 49,508 contracts, respectively.
The crude futures market as a whole therefore changed very little, by a net 3,802 less short. In other words, for all the storms and rhetoric, the crude market by virtue of futures positions continues to be quite balanced. That would suggest not much conviction about a rebalanced (supply exceeded by demand to draw down so much inventory leftover from the real storm, the “rising dollar”) fundamental picture as is always described in the media; while also at the same time not quite fear over downside risks but more positioning to be hedged against them (that seems to be what money managers have done). |
Crude Oil, Jun 2014 - 2017(see more posts on Crude Oil, ) |
| Like a lot of other markets, while also like the ragged end of the last “reflation”, it doesn’t happen all at once. The bond selloff in 2013, for example, was a hurricane of optimism. The restoration of pessimism and the “fear bubble” (as it was called at the time in heralding what as widely believed its end) after it was practically its opposite. It came back slowly and incrementally throughout 2014 in sharp contrast to trading a year earlier.
Maybe that had to do with conventional “wisdom”, meaning even in bonds you don’t fight the Fed (or so many believe). When it looked like the Fed just maybe got QE3 (and 4) right in the summer of 2013, investors stampeded for the exit. As it increasingly appeared instead like the same old economy and global monetary condition, those same investors (meaning banks!) came back timidly and spread out over time until very late in 2014 when the balance of risks finally and very clearly (for market participants, not economists) tipped the wrong way. |
WTI Futures, Dec 2016 - Dec 2020 |
In some ways, oil fundamentals are providing the same service. Inventories while moving in the right direction really aren’t doing so at a pace that is convincing enough. There is still far too much that looks familiar, which for this economic context is still the wrong condition.
It’s not that oil prices should crash tomorrow on saggy fundamentals and resurfacing (downside) risks. It is enough that they aren’t rising after all this time and what has supposedly improved. The futures curve still resists backwardation, even in hurricane-ravaged disruption.
Tags: commodities,COT,Crude Oil,crude stocks,currencies,demand,economy,Featured,Federal Reserve/Monetary Policy,gasoline stocks,Markets,newslettersent,OIL,oil futures,oil prices,supply,WTI

