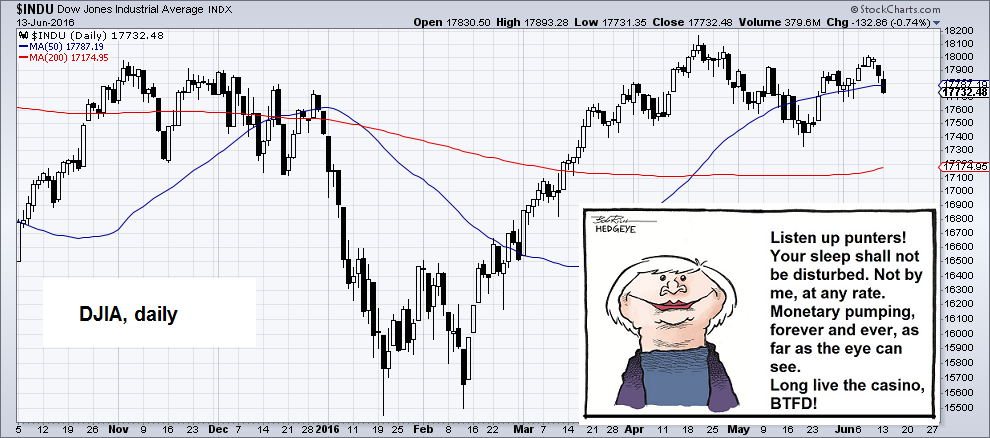
Believe It Or Not… There Actually Is Some Downside Risk BALTIMORE – Not much action in the stock market last week. A few little steps ahead to over the 18,000 line for the Dow. Then a few little steps back. Currently the index sits at 17,732. DJIA, daily Fed chief Janet Yellen has made it clear she won’t do anything to disturb investors’ sleep. But that doesn’t mean they won’t have nightmares. Our research department – headed by Nick Rokke and Chad Champion – reports that you get less for your money in America’s capital markets today than at any time in history. This is not good news. It tells us there is far more downside risk than upside potential. The Dow Jones Yawn Average, daily, plus a special message by Auntie Janet to the punters. Soon they may need an extra dose of Prozac too though – click to enlarge. U.S. GDP Growth Meanwhile, the U.S. economy continues to slow. From the high-water mark of 3.9% annual GDP growth in the second quarter of 2015, the latest figures (for the first quarter of this year) show the economy expanding at an annual rate of just 0.8%. And last week, we learned job creation tumbled in May, with just 38,000 new jobs added versus the 162,000 new jobs Wall Street was expecting. It was the worst report in six years.
Topics:
Bill Bonner considers the following as important: Debt and the Fallacies of Paper Money, DJIA, Dow Jones Yawn Average, Featured, Janet Yellen, newsletter, Nick Rokke, Russell 2000, The Stock Market
This could be interesting, too:
Nachrichten Ticker - www.finanzen.ch writes Die Performance der Kryptowährungen in KW 9: Das hat sich bei Bitcoin, Ether & Co. getan
Nachrichten Ticker - www.finanzen.ch writes Wer verbirgt sich hinter der Ethereum-Technologie?
Martin Hartmann writes Eine Analyse nach den Lehren von Milton Friedman
Marc Chandler writes March 2025 Monthly
Believe It Or Not… There Actually Is Some Downside RiskBALTIMORE – Not much action in the stock market last week. A few little steps ahead to over the 18,000 line for the Dow. Then a few little steps back. Currently the index sits at 17,732. DJIA, dailyFed chief Janet Yellen has made it clear she won’t do anything to disturb investors’ sleep. But that doesn’t mean they won’t have nightmares. Our research department – headed by Nick Rokke and Chad Champion – reports that you get less for your money in America’s capital markets today than at any time in history. This is not good news. It tells us there is far more downside risk than upside potential. |
|
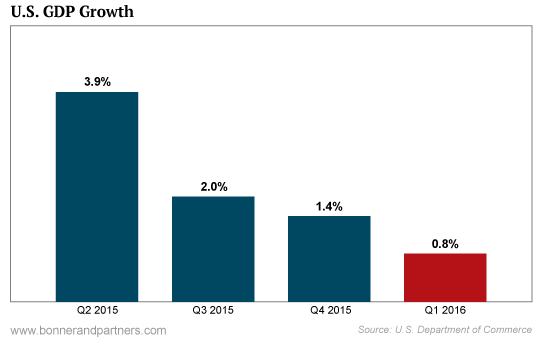
U.S. GDP GrowthMeanwhile, the U.S. economy continues to slow. From the high-water mark of 3.9% annual GDP growth in the second quarter of 2015, the latest figures (for the first quarter of this year) show the economy expanding at an annual rate of just 0.8%. And last week, we learned job creation tumbled in May, with just 38,000 new jobs added versus the 162,000 new jobs Wall Street was expecting. It was the worst report in six years. And it took the labor participation rate – the percentage of the working-age population either working or looking for work – back to a level not seen since 1976. These things do not justify high stock prices. Instead, they buzz in your ear like mosquitoes at an evening picnic. The Zika virus cannot be far off. Most likely, the economy has already begun to get the shakes. If not, the recession will probably begin sometime in the next 12 months. Nick checks the netting:
|
|
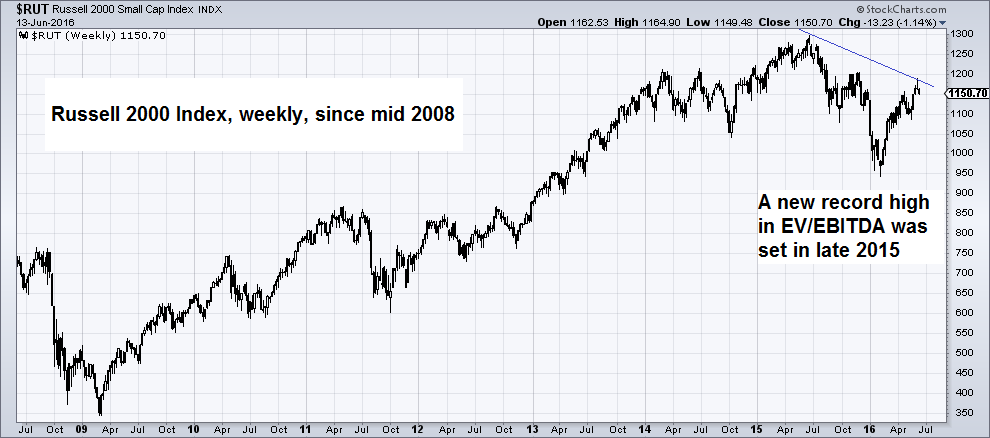
Past PatternsThe EV/EBITDA ratio for the Russell 2000 is about 19. This is only slightly below its all-time high of 21 set at the start of the year. Typically, the index trades on a ratio of about 12. That suggests a fall of 38% for U.S. small caps – a plunge equal to the fifth worst bear market in the past 90 years. Russell 2000 Index, weekly, since mid 2008Russell 2000, weekly. The blue line connecting the 2015 and 2016 highs shows that the RUT is diverging greatly from big cap indexes and averages like the S&P 500 and the DJIA right now, as it has failed to rebound to its previous peak. Since this index was one of the clear upside leaders during most of the preceding bull market, this is quite worrisome. Although this is not necessarily always meaningful, long term tops are often preceded by such divergences. Of course, we’ve been wrong before. And whatever youthful bravery might have accompanied our earlier guesswork, it left us when arthritis moved in. Now, we make no predictions and offer no forecasts. We simply note that based on where valuations are, now is unlikely to be a good time to increase your exposure to U.S. stocks. Remember, our investment strategy is based on ignorance, not knowledge. We have no knowledge of the future. All we have is some dim awareness of the past. What we see in the past are patterns. And since those patterns can be seen in many different markets over many years, we presume them to be fairly reliable. |
|
| So, although we can’t predict that the stock market will go down, or when, or to where… we can still note that it always has in the past, though not according to any reliable schedule. Maybe this time is different. Most likely, it’s not.
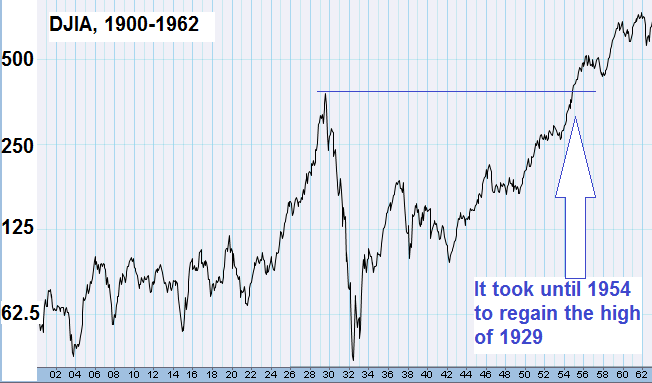
U.S. stocks are expensive. The best bet is probably that they will be less expensive in the future. Then they will be expensive again. Note that these cycles are extremely long. The U.S. stock market hit a high in 1929. It didn’t do so again until 1954. There have been a couple of highs, in 2000 and 2007, but this is higher than any of them. That’s right – this could be the big one! |
Charts by: StockCharts, Bonner& Partners
Chart and image captions by PT
The above article originally appeared as “This Record High Is Terrible News for Stock Bulls” at the Diary of a Rogue Economist, written for Bonner & Partners.


