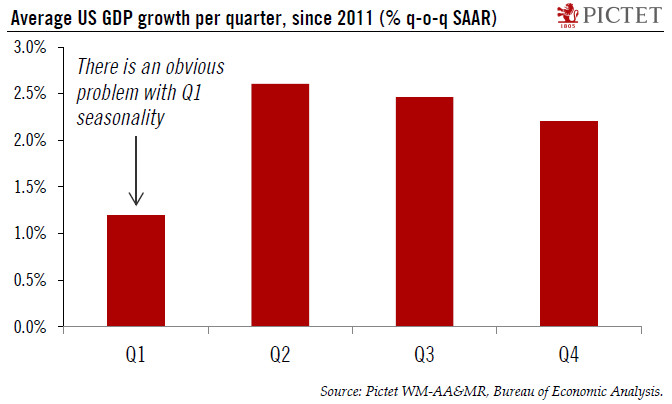
Weak US Q1 GDP growth revives debate about seasonality issues, as solid macroeconomic signals suggest that growth will rebound sharply.Do US statisticians have a problem with seasonal adjustment? The question is likely to arise once again this year as Q1 GDP growth looks set to be on the weak side, despite most other macroeconomic signals – including solid employment growth – flashing green. The Atlanta Fed GDP tracker is now at 1.8%. That would mark a slowdown from 2.5% q-o-q SAAR in Q4-2017.In defence of US statisticians, and particularly the Bureau of Economic Analysis (BEA), which crunches the data used to produce GDP estimates, finding and aggregating data is a bit messy in the US since there is no single national statistical agency like in the UK or in Switzerland but in fact
Topics:
Thomas Costerg considers the following as important: Macroview
This could be interesting, too:
Cesar Perez Ruiz writes Weekly View – Big Splits
Cesar Perez Ruiz writes Weekly View – Central Bank Halloween
Cesar Perez Ruiz writes Weekly View – Widening bottlenecks
Cesar Perez Ruiz writes Weekly View – Debt ceiling deadline postponed
Weak US Q1 GDP growth revives debate about seasonality issues, as solid macroeconomic signals suggest that growth will rebound sharply.
Do US statisticians have a problem with seasonal adjustment? The question is likely to arise once again this year as Q1 GDP growth looks set to be on the weak side, despite most other macroeconomic signals – including solid employment growth – flashing green. The Atlanta Fed GDP tracker is now at 1.8%. That would mark a slowdown from 2.5% q-o-q SAAR in Q4-2017.
In defence of US statisticians, and particularly the Bureau of Economic Analysis (BEA), which crunches the data used to produce GDP estimates, finding and aggregating data is a bit messy in the US since there is no single national statistical agency like in the UK or in Switzerland but in fact several of them that are not easy to coordinate. The BEA has to contact the Census Bureau, the Bureau of Labor Statistics, and the Federal Reserve, among others, to compile its GDP report. (As an aside, the Federal Reserve is, rather puzzlingly, responsible for collecting industrial production data).
In the end, we think the Q1 GDP weakness should be ignored, precisely because it looks like an outlier in an otherwise solid growth environment and because we suspect there are distorsions caused by residual seasonality. In other words, since US statisticians periodically have a problem with winter data (see chart), let’s wait for the spring to form a better idea of US growth. In the meantime, one can point to employment growth and business surveys, which are still flashing green and suggesting that Q2 growth will rebound sharply. To name but one piece of evidence pointing in this direction, the February ISM manufacturing survey rose to its highest level since 2004.