Swiss Franc Currency Index The Swiss Franc continues to under-perform the dollar index in the month after Brexit. Click to enlarge. Swiss Franc Currency Index (3 years) The Swiss Franc index is the trade-weighted currency performance (see the currency basket) On a three years interval, the Swiss Franc had a weak performance. The dollar index was far stronger. The dollar makes up 40% of the SNB portfolio and of Swiss exports. Contrary to popular believe, the CHF index gained only 1.73% in 2015. It lost 9.52% in 2014., when the dollar (and yuan) strongly improved. Click to enlarge. EUR/CHF The EUR/CHF barely changed in the last week. After initial risk appetite with the election of Theresa May, it rose to 1.940, but fell again at the end of the week. FX Rates July 11 to July 15, 2016 Click to enlarge. US Dollar The US dollar is easily the most traded currency, and despite the plethora of other currencies, it is on one side of nearly 90% of all trades. Yet the movement in the foreign exchange market presently is not so much driven by the dollar as it is by other currencies. FX Rates July 11 to July 15, 2016 Click to enlarge. EUR/USD The euro was essentially flat last week. The poor close before the weekend leaves the single currency poised to test the .
Topics:
George Dorgan considers the following as important: Crude Oil, EUR/CHF, EUR/USD, Featured, FX Trends, FX Weekly Review, MACDs, newslettersent, Safe-haven, U.S. Treasuries, US Dollar Index, USD/CAD, USD/CHF
This could be interesting, too:
Nachrichten Ticker - www.finanzen.ch writes Die Performance der Kryptowährungen in KW 9: Das hat sich bei Bitcoin, Ether & Co. getan
Nachrichten Ticker - www.finanzen.ch writes Wer verbirgt sich hinter der Ethereum-Technologie?
Marc Chandler writes March 2025 Monthly
Mark Thornton writes Is Amazon a Union-Busting Leviathan?
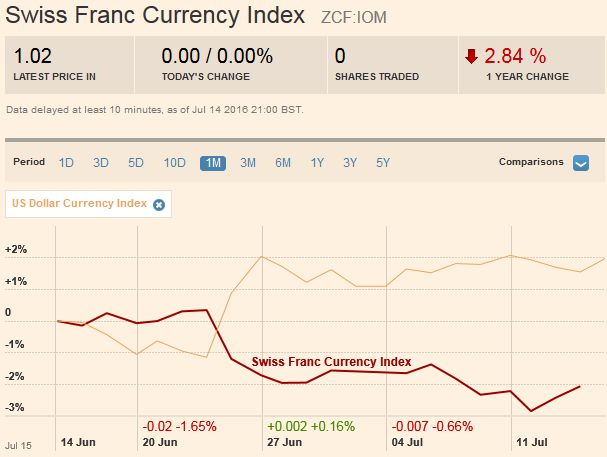
Swiss Franc Currency IndexThe Swiss Franc continues to under-perform the dollar index in the month after Brexit. |
|
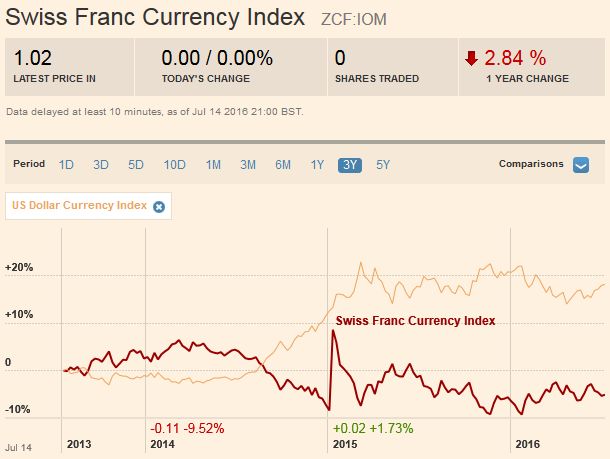
Swiss Franc Currency Index (3 years)The Swiss Franc index is the trade-weighted currency performance (see the currency basket) On a three years interval, the Swiss Franc had a weak performance. The dollar index was far stronger. The dollar makes up 40% of the SNB portfolio and of Swiss exports. Contrary to popular believe, the CHF index gained only 1.73% in 2015. It lost 9.52% in 2014., when the dollar (and yuan) strongly improved. |
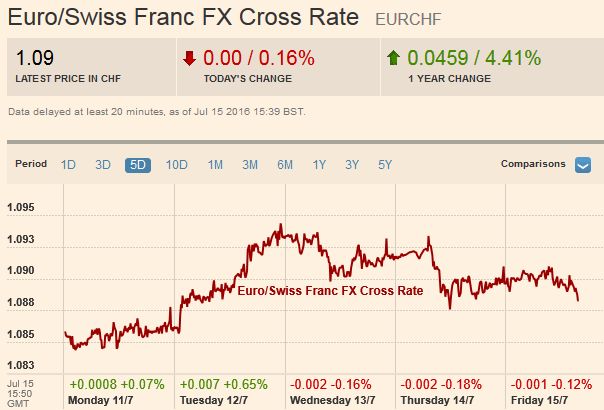
EUR/CHFThe EUR/CHF barely changed in the last week. After initial risk appetite with the election of Theresa May, it rose to 1.940, but fell again at the end of the week. |
FX Rates July 11 to July 15, 2016 |
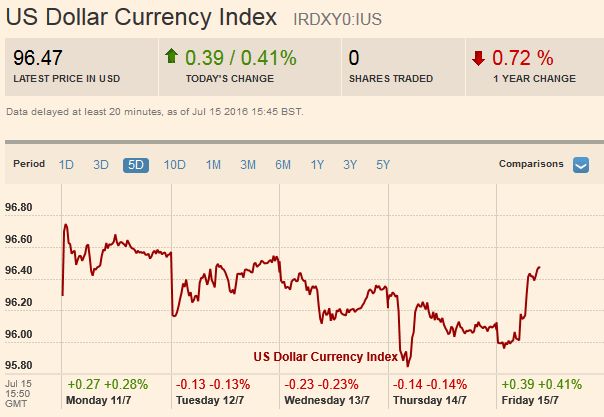
US DollarThe US dollar is easily the most traded currency, and despite the plethora of other currencies, it is on one side of nearly 90% of all trades. Yet the movement in the foreign exchange market presently is not so much driven by the dollar as it is by other currencies.
|
FX Rates July 11 to July 15, 2016 |
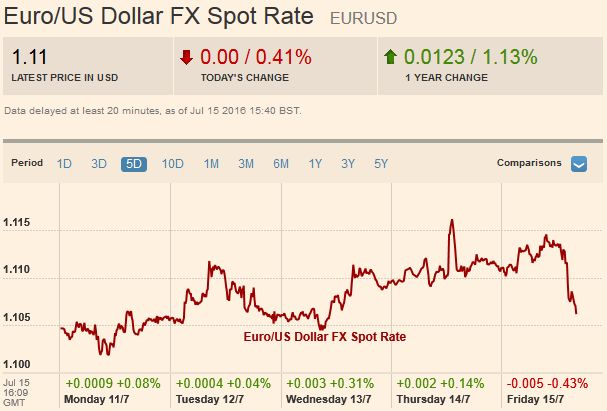
EUR/USDThe euro was essentially flat last week. The poor close before the weekend leaves the single currency poised to test the $1.10 area that has held outside the immediate aftermath of the UK referendum. With many participants expecting the ECB will move away from its capital key determinant of its bond purchase program in the week ahead, the euro may not be able to sustain upticks ahead of the meeting. We suspect it is too early for the ECB to make such a decision, and if the market is disappointed, the euro could bounce. The Norwegian krone was the second best performing major currency after sterling, rising 1.1% over the past week. Higher inflation coupled with the 1% recovery in oil prices lent it support. The risk of another rate cut has diminished. |
|
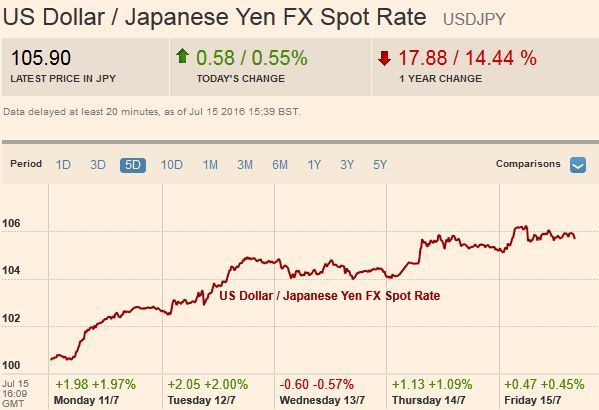
USD/JPYThe yen weakened dramatically in recent days. The nearly 5.2% decline, prior to the Turkish developments, was driven anticipation of Abenomics 2.0, with new monetary and fiscal stimulus. The Abenomics trade was short yen and long Japanese equities. This had been unwound and helps explain the yen’s strength in H1 16. However, expectations of new and aggressive stimulus (captured in the talk of “helicopter money”), some participants are again selling the yen and buying Japanese stocks (the Nikkei advanced 9.2% last week).
The JPY106.70-JPY106.85 area is an important hurdle for the dollar. A convincing break could signal a recovery toward JPY110, which is about a 50% retracement of this year’s move. However, before getting there, there is a band (JPY107.70-JPY108.60) that may take some time to overcome. In thin NY activity before the weekend, the dollar dropped nearly a big figure (from ~JPY105.50 to ~JPY104.50) on the Turkey could attempt. However, the failure of the coup will likely allow the dollar to return to status quo ante.
|
|
GBP/USD
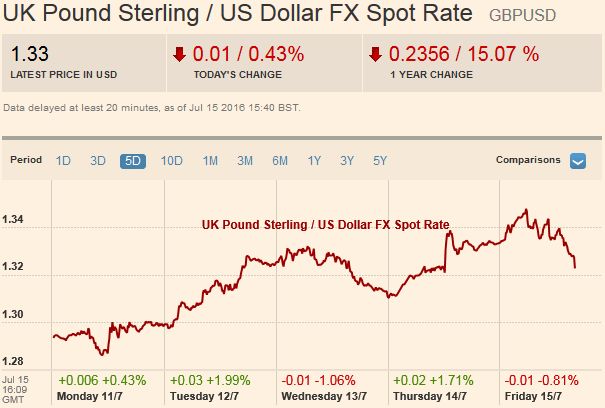
Sterling approached $1.35 by the end of last week after testing $1.2850 to start the week. The new UK government was an element of stability after a vacuum emerged after the referendum. The Bank of England’s reluctance to immediately back up its sober economic assessment with change in monetary policy also helped sterling recover.
However, investors have not given up on BOE easing. Official signals indicate it is a few weeks away, and that it is unlikely to be limited to small rate cut. The $1.35 area is important for sterling. It is a neckline of a potential head and shoulders pattern, which if confirmed would project toward $1.4200. The 20-day moving average, which sterling has not been above since the referendum is found near $1.3520. The technical indicators are constructive, but the price action before the weekend was not encouraging, even before the news of the coup attempt in Turkey. Support is seen initially near $1.3120-$1.3150.
|
|
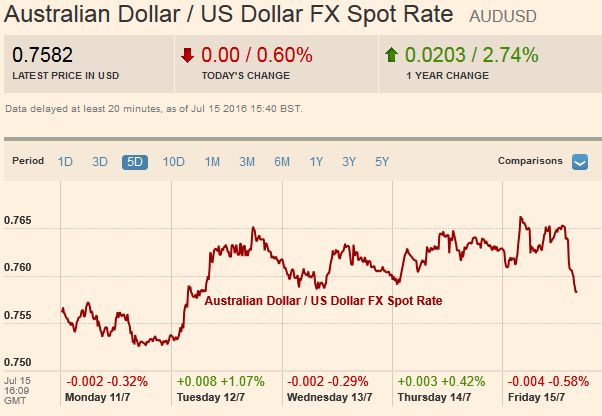
AUD/USDThe Australian dollar posted a key reversal before the weekend, even before the last leg down late in the North American session in response to the developments in Turkey. It made a new high for the move and then sold off, through the previous days low. The break of $0.7575 would suggest potential toward $0.7475-$0.7500, however, given that the coup attempt was defeated, the Aussie may first try to recover from knee-jerk losses. A move above the $0.7650 area would be an early sign that the bearish scenario is not panning out. The New Zealand dollar was the second weakest major currency after the yen. Next week’s unscheduled RBNZ economic assessment is seen as paving the way for a rate cut as soon as next month. This saw the Kiwi, which had made new highs for the year on July 12, selling off and finish the week down about 2.5%. |
|
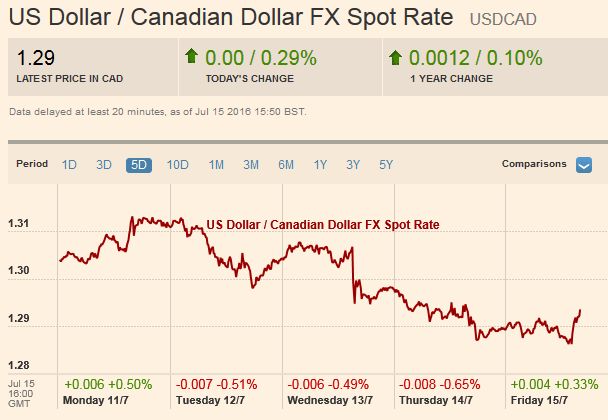
USD/CADThe Canadian dollar rose 0.5% against the US dollar last week. The Bank of Canada did trim its growth forecast, but still seemed optimistic that activity would improve in H2. The Canadian dollar strengthened, but ran out of steam in front of the previous week’s high and turned back down, with a poor close ahead of the weekend. The risk is that the US dollar pushes beyond CAD1.30 to the upper end of the recent range found near CAD1.3140. |
|
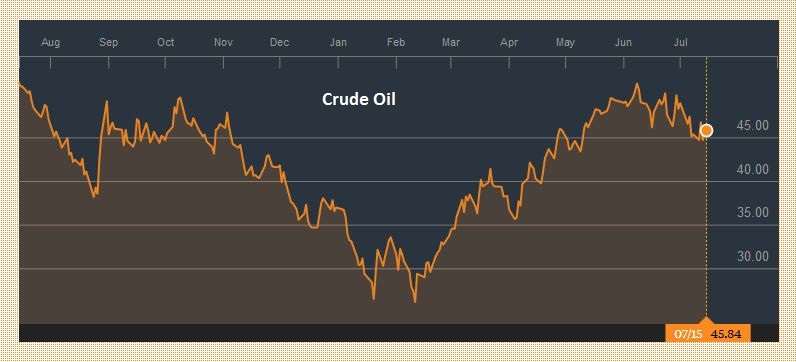
Crude OilOpen interest is moving into the September light sweet oil futures contract. Since peaking a little above $52.70 in early-June, the price of oil has pulled back. The bears tried pushing it through $45 several times in recent days but to no avail. On a bounce, the first target is near $48, which also corresponds to the 20-day moving average. The RSI is neutral, around 45 and the MACDs are poised to cross higher.
|
 Click to enlarge. Source Bloomberg.com |
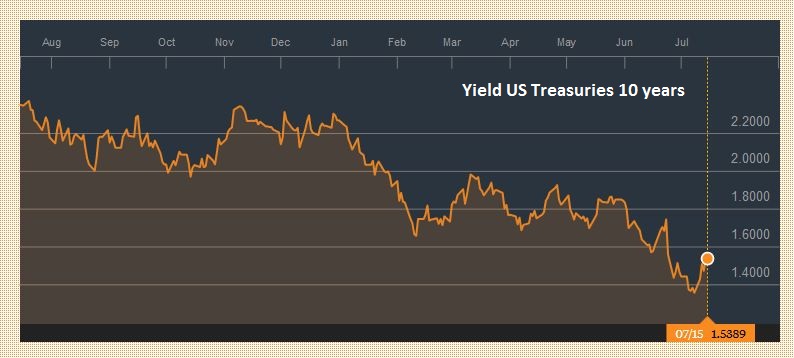
US TreasuriesThe combination of the stabilization of the UK political situation coupled with mostly constructive US data saw the US 10-year Treasury yield rise from 1.36% on July 8 to almost 1.60% on July 15. As safe haven flows unwind, and participants begin pricing in a somewhat greater chance of a rate hike (and forget that flirtation with a rate cut), US 10-year yields can rise back to the 1.70%-1.75% range. The September 10-year note futures tested a trendline drawn off the late-May low. It is found near 131-22, which also corresponds with a retracement objective. A break signals a push to at least 131, and possibly 130-16. The losses before the weekend were sufficient to see the five-day moving average fall below the 20-day average for the first time in six weeks. |
 Click to enlarge. Source Bloomberg.com |
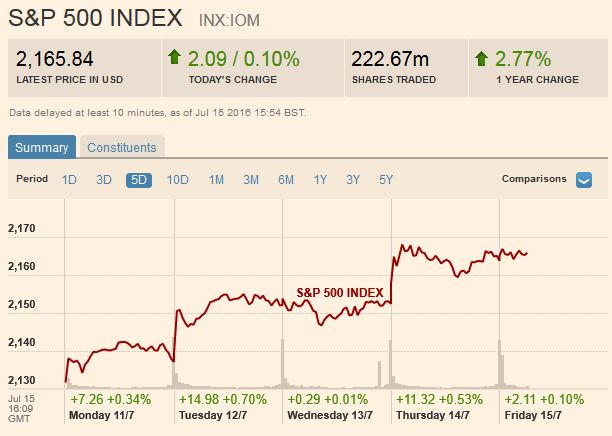
S&P 500The S&P 500 made new record highs before the weekend near 2169. It was not able to sustain the upward advance and was pushed lower on profit-taking. A retracement of the latest leg up (from July 6) could see the S&P 500 ease back toward the 2120-2132 area. Yet the fact that the dividend yield of the S&P 500 is 2.5%, which is 25 bp above the 30-year Treasury yield illustrates a major consideration that provides an underlying source of demand. |
Charts and CHF data added by George Dorgan and the snbchf team, Text Posted by Marc Chandler on Marc to Markets,

