Keynes and others may have referred to gold as a barbarous relic, but many investors continue to track it. In early January, we warned that gold appeared to be breaking out of a short-term bottoming pattern.It had taken out a three-month downtrend line, which we suggested was part of a triangle pattern. Gold also traced out a double bottom pattern. The triangle pattern pointed to a move toward 10 and the double bottom projected to around 35. The yellow metal poked through 57 today and remains near it highs in late turnover. Gold Price 2013-2016 We did not anticipate the macro considerations that drove it; gold has surpassed these targets. In the larger scheme of things, gold is still bouncing along its trough. Most of the technical indicators we look are still constructive. Our concern is that gold is trading above its upper Bollinger Band (~48), The Great Graphic, created on Bloomberg, shows a longer-term bar chart of gold. We drew in a trendline. It comes in just below $.1200, which also corresponds to the high from last October. It is our next objective. This was the technical view. Coming to the fundamental data: Macro-economic data from the United States, in particular manufacturing indices under 50, point to further dollar weakness. This should be positive for gold.
Topics:
Marc Chandler considers the following as important: Featured, Great Graphic, Monetary Metals, newsletter
This could be interesting, too:
Eamonn Sheridan writes CHF traders note – Two Swiss National Bank speakers due Thursday, November 21
Charles Hugh Smith writes How Do We Fix the Collapse of Quality?
Marc Chandler writes Sterling and Gilts Pressed Lower by Firmer CPI
Michael Lebowitz writes Trump Tariffs Are Inflationary Claim The Experts
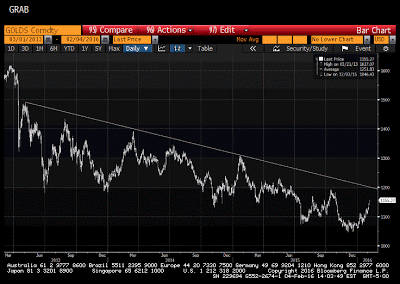
Keynes and others may have referred to gold as a barbarous relic, but many investors continue to track it. In early January, we warned that gold appeared to be breaking out of a short-term bottoming pattern.It had taken out a three-month downtrend line, which we suggested was part of a triangle pattern. Gold also traced out a double bottom pattern. The triangle pattern pointed to a move toward $1110 and the double bottom projected to around $1135. The yellow metal poked through $1157 today and remains near it highs in late turnover.
We did not anticipate the macro considerations that drove it; gold has surpassed these targets. In the larger scheme of things, gold is still bouncing along its trough. Most of the technical indicators we look are still constructive. Our concern is that gold is trading above its upper Bollinger Band (~$1148), The Great Graphic, created on Bloomberg, shows a longer-term bar chart of gold. We drew in a trendline. It comes in just below $.1200, which also corresponds to the high from last October. It is our next objective.
This was the technical view. Coming to the fundamental data:
Macro-economic data from the United States, in particular manufacturing indices under 50, point to further dollar weakness. This should be positive for gold.
On the other side, continuing job creation in both the US and Europe, is rather negative for the yellow metal.

