USD/CHF nears 100-day SMA amid yet another bounce off 50% Fibonacci retracement. 61.8% of Fibonacci retracement adds support to the downside. With its yet another bounce off 50% Fibonacci retracement of August-October advances, USD/CHF nears 100-day Simple Moving Average (SMA) while taking the bids to 0.9865 amid initial trading on Monday. Should prices manage to close beyond a 100-day SMA level of 0.9871, early October lows near 0.9900 and 0.9940/43 resistance confluence, including a monthly falling trend line and 23.6% Fibonacci retracement, holds the key to pair’s rise towards 200-day SMA level of 0.9955. In a case where the quote rallies beyond 0.9955, 1.0000 and the previous month high close to 1.0030 will be the key to watch. If at all sellers sneak in
Topics:
Anil Panchal considers the following as important: 1.) FXStreet on SNB&CHF, 1) SNB and CHF, Featured, newsletter, USD/CHF
This could be interesting, too:
Nachrichten Ticker - www.finanzen.ch writes Die Performance der Kryptowährungen in KW 9: Das hat sich bei Bitcoin, Ether & Co. getan
Nachrichten Ticker - www.finanzen.ch writes Wer verbirgt sich hinter der Ethereum-Technologie?
Martin Hartmann writes Eine Analyse nach den Lehren von Milton Friedman
Marc Chandler writes March 2025 Monthly
- USD/CHF nears 100-day SMA amid yet another bounce off 50% Fibonacci retracement.
- 61.8% of Fibonacci retracement adds support to the downside.
| With its yet another bounce off 50% Fibonacci retracement of August-October advances, USD/CHF nears 100-day Simple Moving Average (SMA) while taking the bids to 0.9865 amid initial trading on Monday.
Should prices manage to close beyond a 100-day SMA level of 0.9871, early October lows near 0.9900 and 0.9940/43 resistance confluence, including a monthly falling trend line and 23.6% Fibonacci retracement, holds the key to pair’s rise towards 200-day SMA level of 0.9955. In a case where the quote rallies beyond 0.9955, 1.0000 and the previous month high close to 1.0030 will be the key to watch. If at all sellers sneak in around 50% Fibonacci retracement level of 0.9843, an extended decline below 61.8% Fibonacci retracement level of 0.9800 is widely anticipated. Additionally, a sustained trading below 0.9800 could give rise to late-August low, near 0.9715, on the bear’s radar. |
USD/CHF daily chart(see more posts on USD/CHF, )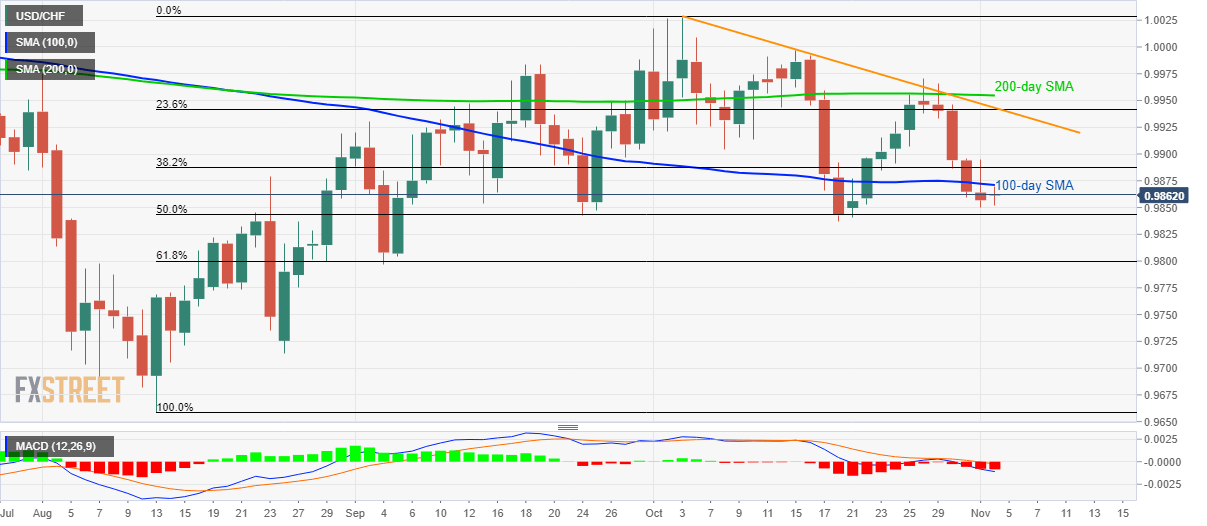 - Click to enlarge |
Trend: bullish
Tags: Featured,newsletter,USD/CHF