An Example of Strong Single Stock Seasonality Many individual stocks exhibits phases of seasonal strength. Being invested in these phases is therefore an especially promising strategy. Today I want to introduce you to a stock that tends to advance particularly strongly at this time of the year: Novo Nordisk. The Danish pharmaceutical group supplies a broad range of products and is a global market leader in diabetes drugs. Danish drug company Novo Nordisk Novo Nordisk exhibits a brief, but very strong seasonal phase Take a look at the seasonal chart of Novo Nordisk below. This is not a standard price chart showing prices moves over a specific time period. Rather, the seasonal chart depicts the average price pattern of Novo Nordisk in the course of a calendar
Topics:
Dimitri Speck considers the following as important: 6b.) Acting Man, 6b) Austrian Economics, 7) Markets, Featured, newsletter, The Stock Market
This could be interesting, too:
Nachrichten Ticker - www.finanzen.ch writes Die Performance der Kryptowährungen in KW 9: Das hat sich bei Bitcoin, Ether & Co. getan
Nachrichten Ticker - www.finanzen.ch writes Wer verbirgt sich hinter der Ethereum-Technologie?
Martin Hartmann writes Eine Analyse nach den Lehren von Milton Friedman
Marc Chandler writes March 2025 Monthly
An Example of Strong Single Stock SeasonalityMany individual stocks exhibits phases of seasonal strength. Being invested in these phases is therefore an especially promising strategy. Today I want to introduce you to a stock that tends to advance particularly strongly at this time of the year: Novo Nordisk. The Danish pharmaceutical group supplies a broad range of products and is a global market leader in diabetes drugs. |
Danish drug company Novo Nordisk |
Novo Nordisk exhibits a brief, but very strong seasonal phaseTake a look at the seasonal chart of Novo Nordisk below. This is not a standard price chart showing prices moves over a specific time period. Rather, the seasonal chart depicts the average price pattern of Novo Nordisk in the course of a calendar year over the past 10 years. I have highlighted the especially strong seasonal phase from February 11 to February 22 in blue. In this time period Novo Nordisk displays a particularly strong seasonal advance. |
Novo Nordisk, seasonal pattern over the past 10 years The stock typically rallies particularly strongly in mid February - Click to enlarge |
A gain of 495.78 percent annualized!Over the past 10 years Novo Nordisk rose in every single year in this phase. In other words, the pattern had a hit rate of 100 percent. The average gain achieved in these mere eight trading days amounted to 5.01 percent. This corresponds to an extremely strong annualized gain of 495.78 percent! The following bar chart shows the pattern return for the time period February 11 to February 22 in every single year since 2010. As this chart confirms, in the past ten years prices indeed rose over these eight trading days in every single year. The largest gain achieved in 2015 amounted to 11.46 percent! In my opinion such large seasonal gains in such a short time period represent a phenomenal opportunity. The appeal of investing in particularly strong seasonal phases and thus significantly increasing the chance of generating extraordinary returns should be obvious. |
Novo Nordisk, percentage returns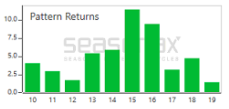 Novo Nordisk, percentage return of the seasonal rally between Feb. 11 and Feb. 22 in every year since 2010. The stock rallied in every year under review. - Click to enlarge |
Take advantage of single stock seasonality!
As you can see, individual stocks exhibit their very own seasonal patterns which often include very attractive phases of strength. On our web page www.app.seasonax.com or alternatively on the Seasonax app at Bloomberg or Thomson-Reuters Eikon, promising seasonal patterns of thousands of individual shares are waiting to be discovered!
Charts by Seasonax
Chart & image captions (where indicated) by PT
Tags: Featured,newsletter,The Stock Market