One day the stock market ‘falcon’ will no longer hear the Fed ‘falconer’, and the Pavlovian magical thinking will break down as the market goes bidless. The past decade has shown that when the Federal Reserve creates trillions of dollars out of thin air (QE), U.S. stocks rise accordingly. The correlation is very nearly perfect. This has given rise to the belief that buyers of stocks will always be rewarded because “the Fed has our backs.” The evidence for this belief is the near-perfect correlation of Fed money-printing and stocks soaring. This near-universal belief in the omnipotent Fed raises an interesting question: how much actual control does the Fed have on the U.S. stock market? One way to approach this question is to plot the size (to scale) of the
Topics:
Charles Hugh Smith considers the following as important: 5.) Charles Hugh Smith, 5) Global Macro, Featured, newsletter
This could be interesting, too:
Nachrichten Ticker - www.finanzen.ch writes Die Performance der Kryptowährungen in KW 9: Das hat sich bei Bitcoin, Ether & Co. getan
Nachrichten Ticker - www.finanzen.ch writes Wer verbirgt sich hinter der Ethereum-Technologie?
Martin Hartmann writes Eine Analyse nach den Lehren von Milton Friedman
Marc Chandler writes March 2025 Monthly
|
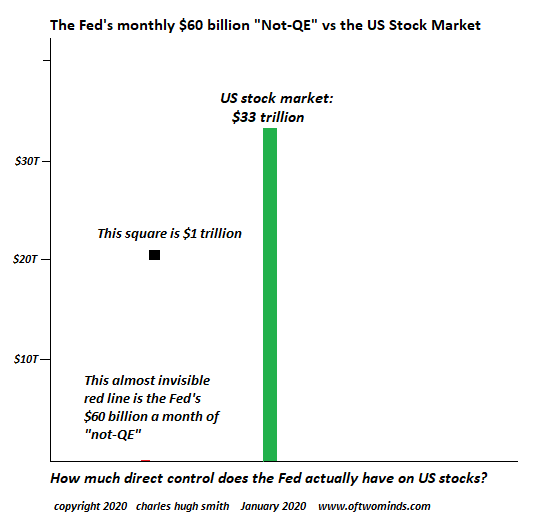
One day the stock market ‘falcon’ will no longer hear the Fed ‘falconer’, and the Pavlovian magical thinking will break down as the market goes bidless. The past decade has shown that when the Federal Reserve creates trillions of dollars out of thin air (QE), U.S. stocks rise accordingly. The correlation is very nearly perfect. This has given rise to the belief that buyers of stocks will always be rewarded because “the Fed has our backs.” The evidence for this belief is the near-perfect correlation of Fed money-printing and stocks soaring. This near-universal belief in the omnipotent Fed raises an interesting question: how much actual control does the Fed have on the U.S. stock market? One way to approach this question is to plot the size (to scale) of the Fed’s current money-printing campaign of $60 billion per month, “Not-QE,” to the market cap (total value) of U.S. stocks, using the Wilshire 5000 as the measuring stick and the St. Louis Federal Reserve database (FRED) as the data source. This first chart shows the Fed’s $60 billion per month “Not-QE” in relation the $33 trillion market value of U.S. stocks. The nearly invisible thin red line is $60 billion in relation to $33 trillion. So exactly how does this signal-noise sum translate into “the Fed has our backs”? |
U.S. Stock Market |
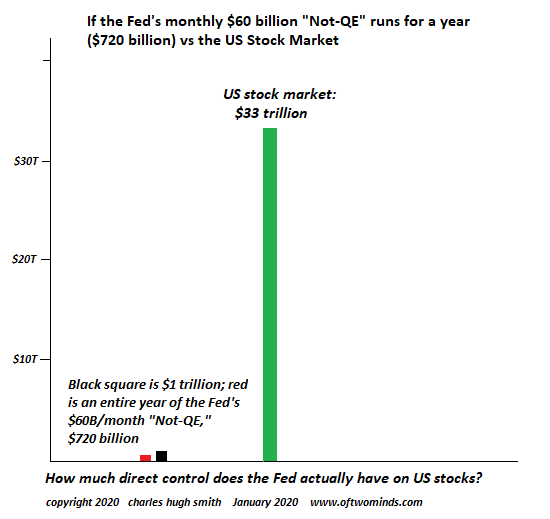
| But wait, you say; it’s not the monthly total that counts, it’s the annual total of Fed money-printing that counts. Your wish is my command: the second chart plots the relative size of $60B X 12 = $720 billion, should the Fed extend “Not-QE” for an entire year, compared to the $33 trillion U.S. stock market.
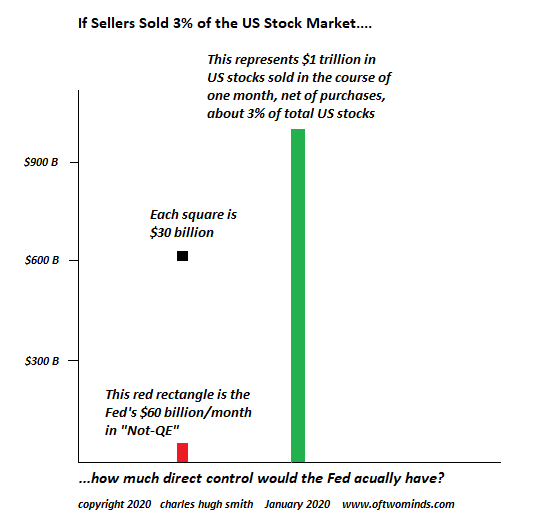
Hmm, $720 billion isn’t very much compared to the stock market. This raises the same question: how much direct control does the Fed have on U.S. stocks? Every month there is buying and selling of stocks, in relatively low volumes. If there’s more buying volume than selling volume, we can say there is X buying volume net of selling volume. If there’s more selling volume than buying volume, we can say there is X selling volume net of buying volume. By way of a thought experiment, let’s say sellers unload 3% of the U.S. stock market market cap, net of buying, in the course of a month. This 3% equals about $1 trillion. Now 3% isn’t that much; a real sell-off could see owners dumping far higher percentages of the stock market’s total valuation. The third chart plots one month of the Fed’s “Not-QE” ($60 billion) compared to $1 trillion in net selling over one month. Hmm… even when compared to a mere 3% of the stock market’s market value, the Fed’s $60 billion is a popgun, not a bazooka, much less a nuclear detonation. |
Fed Monthly vs U.S. Stock Market |
| In claiming “the Fed has our backs,” buyers are claiming that $60 billion in Fed money-printing has essentially total control of a $33 trillion market. Looking at these sums to scale should raise some doubt about the direct control the Fed exerts on the stock market.
What’s actually driving stocks higher is the psychology of buyers anticipating everyone else buying because of Fed money-printing, not the money-printing itself. It’s clear that any sort of even modest selling pressure will completely overwhelm the Fed’s “Not-QE” popgun. We might productively recall that there is no law requiring the currency the Fed creates to flow into the stock market. The $60 billion might flow into bonds, or commodities, or some other form of financial asset (mortgage backed securities, bat guano derivatives, etc.). Understood in this fashion–the modest size of “Not-QE” compared to the $33 trillion stock market, and the complete absence of direct Fed control of the stock market–the psychology of buying in anticipation of others buying in a Pavlovian response to Fed money-printing is fundamentally a form of magical thinking that reflects the durability of the Pavlovian reaction, not actual Fed control of the stock market. The difference between the two will start to matter when a sell-off overwhelms the Fed’s “Not-QE” popgun. Don’t think it won’t happen just because it hasn’t happened yet. As per Yeats, Turning and turning in the widening gyre, The falcon cannot hear the falconer; one day the stock market ‘falcon’ will no longer hear the Fed ‘falconer’, and the Pavlovian magical thinking will break down as the market goes bidless. |
U.S. Stock Market, January 2020 |
Tags: Featured,newsletter


