The money supply growth rate rose again in February, climbing to a 37-month high. The last time the growth rate was higher was during February of 2017, when the growth rate was 7.9 percent. During February 2020, year-over-year (YOY) growth in the money supply was at 7.49 percent. That’s up from January’s rate of 6.32 percent, and up from February 2019’s rate of 3.20 percent. The increase in money supply growth in February represents a sizable reversal of the trend we saw during most of 2019. In August, the growth rate hit a 120-month low, falling to the lowest growth rates we’d seen since 2007. If the trend continues, growth rates will need only a few months to reach the heights reached from 2009 to 2016. The money supply metric used here—the “true” or
Topics:
Ryan McMaken considers the following as important: 6b) Mises.org, Featured, newsletter
This could be interesting, too:
Nachrichten Ticker - www.finanzen.ch writes Die Performance der Kryptowährungen in KW 9: Das hat sich bei Bitcoin, Ether & Co. getan
Nachrichten Ticker - www.finanzen.ch writes Wer verbirgt sich hinter der Ethereum-Technologie?
Martin Hartmann writes Eine Analyse nach den Lehren von Milton Friedman
Marc Chandler writes March 2025 Monthly
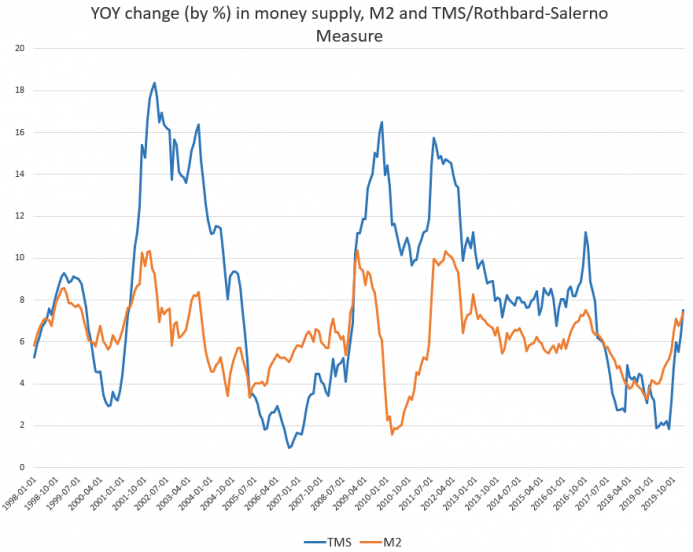
| The money supply growth rate rose again in February, climbing to a 37-month high. The last time the growth rate was higher was during February of 2017, when the growth rate was 7.9 percent.
During February 2020, year-over-year (YOY) growth in the money supply was at 7.49 percent. That’s up from January’s rate of 6.32 percent, and up from February 2019’s rate of 3.20 percent. The increase in money supply growth in February represents a sizable reversal of the trend we saw during most of 2019. In August, the growth rate hit a 120-month low, falling to the lowest growth rates we’d seen since 2007. If the trend continues, growth rates will need only a few months to reach the heights reached from 2009 to 2016. The money supply metric used here—the “true” or Rothbard-Salerno money supply measure (TMS)—is the metric developed by Murray Rothbard and Joseph Salerno, and is designed to provide a better measure of money supply fluctuations than M2. The Mises Institute now offers regular updates on this metric and its growth. This measure of the money supply differs from M2 in that it includes Treasury deposits at the Fed (and excludes short-time deposits, traveler’s checks, and retail money funds). |
M2 and TMS/Rothbard-solerno Measure, 1998-2019 |
|
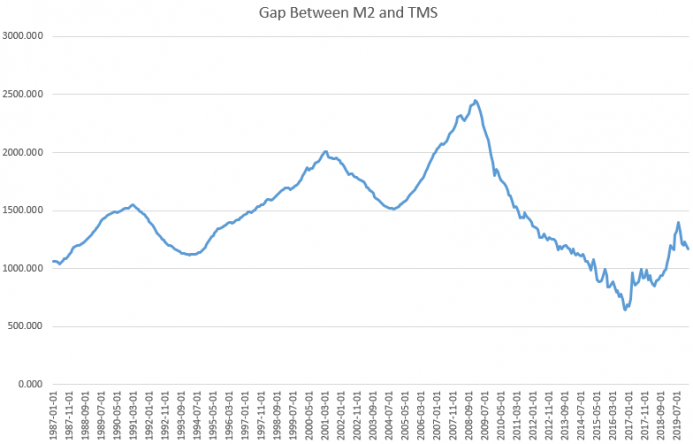
The M2 growth rate also increased in February, growing 7.42 percent compared to January’s growth rate of 6.98 percent. M2 grew 4.11 percent during February of last year. The M2 growth rate had fallen considerably from late 2016 to late 2018, but has been growing again in recent months. Money supply growth can often be a helpful measure of economic activity. During periods of economic boom, money supply tends to grow quickly as banks make more loans. Recessions, on the other hand, tend to be preceded by periods of slowdown in rates of money supply growth. However, money supply growth tends to grow out of its low-growth trough well before the onset of recession. As recession nears, the TMS growth rate climbs and becomes larger than the M2 growth rate. This occurred in the early months of the 2002 and the 2009 crises. February 2020 was the first month since late 2008 that the TMS growth rate climbed higher than the M2 growth rate. If recession does occur in 2020, the relationship between recessions and a preceding drop in money supply growth would appear to continue. Periods preceding recessions also often show a growing gap between M2 growth and TMS growth. We saw this in 2006–7 and in 2000–1. The gap between M2 and TMS narrowed considerably from 2011 through 2015 but has widened since then. |
Gap Between M2 and TMS, 1987-2019 |
|
The overall M2 total money supply in February was $15.4 trillion, and the TMS total was $14.3 trillion. The growth in the money supply is in part tied to the fact that the Federal Reserve grew more accommodative in late 2019. The Federal Open Market Committee (FOMC) cut the target fed funds rate more than once in the months preceding February 2020, but the big change was in the Fed’s late-2019 moves to increase its balance sheet again. Since late August, the Fed has added more than $400 billion to its total assets in an effort to provide a “blast of cash” for the repo market. These funds do not directly fuel money supply growth in the regular economy, but they do provide liquidity to financial institutions, which allows for greater loan volume. The Fed apparently has concluded that the market requires additional liquidity and has acted accordingly. Fed assets are now headed to new peak levels, although the Fed’s renewed quantitative easing efforts do not show up yet in this data. Another change partially driving the increase in the TMS is the large increase in Treasury deposits at the Fed that we’ve seen in recent months. In February 2020, this sum reached an all-time high of $423 billion. |
Treasury Deposits with Federal Reserve Banks, 2007-2020 |
Tags: Featured,newsletter


