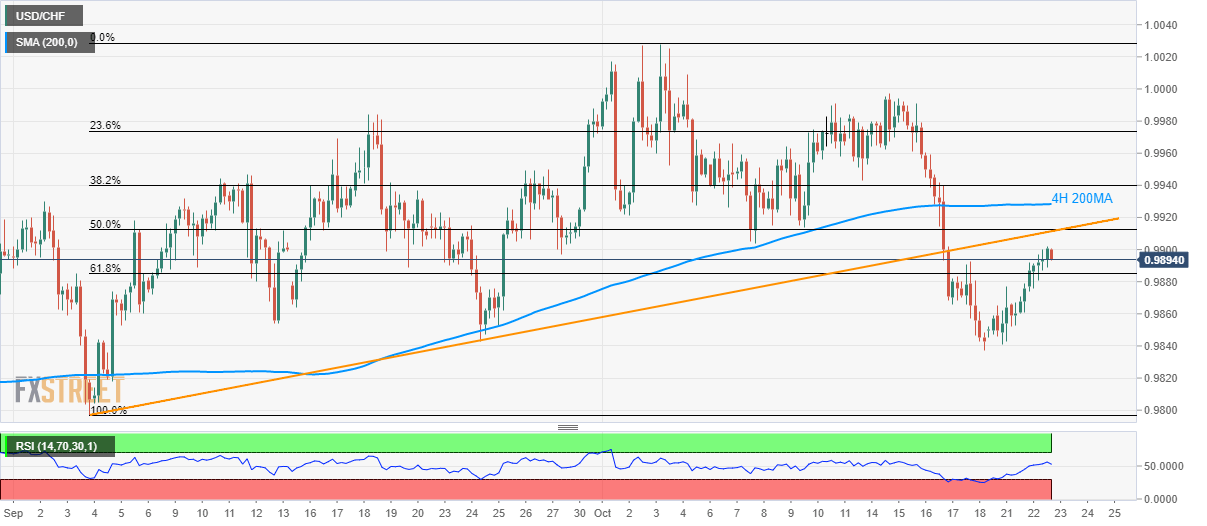
USD/CHF struggles to hold the latest recovery gains. A seven-week-old rising trend line, 50% Fibonacci retracement acts as the closest upside barrier. 61.8% of Fibonacci retracement offers adjacent support. The USD/CHF pair’s recovery from 0.9840 seems to lack momentum as the quote witnesses a pullback to 0.9900 ahead of the European session opening on Wednesday. With this, the 61.8% Fibonacci retracement level of September-October rise, at 0.9885, acts as the close support to watch as a break of which can recall 0.9840 on the chart. Assuming the price decline below 0.9840, September month bottom close to 0.9800 will be on the sellers’ watch-list. On the upside, a seven-week-old rising trend line, 50% Fibonacci retracement acts as an adjacent resistance, near
Topics:
Anil Panchal considers the following as important: 1.) FXStreet on SNB&CHF, 1) SNB and CHF, Featured, newsletter, USD/CHF
This could be interesting, too:
Nachrichten Ticker - www.finanzen.ch writes Die Performance der Kryptowährungen in KW 9: Das hat sich bei Bitcoin, Ether & Co. getan
Nachrichten Ticker - www.finanzen.ch writes Wer verbirgt sich hinter der Ethereum-Technologie?
Martin Hartmann writes Eine Analyse nach den Lehren von Milton Friedman
Marc Chandler writes March 2025 Monthly
- USD/CHF struggles to hold the latest recovery gains.
- A seven-week-old rising trend line, 50% Fibonacci retracement acts as the closest upside barrier.
- 61.8% of Fibonacci retracement offers adjacent support.
| The USD/CHF pair’s recovery from 0.9840 seems to lack momentum as the quote witnesses a pullback to 0.9900 ahead of the European session opening on Wednesday.
With this, the 61.8% Fibonacci retracement level of September-October rise, at 0.9885, acts as the close support to watch as a break of which can recall 0.9840 on the chart. Assuming the price decline below 0.9840, September month bottom close to 0.9800 will be on the sellers’ watch-list. On the upside, a seven-week-old rising trend line, 50% Fibonacci retracement acts as an adjacent resistance, near 0.9912/15, ahead of 200-bar simple moving average on the four-hour chart (4H 200MA), at 0.9930 now. It should, however, be noted that the pair’s rise past-0.9930 enables it to aim for 1.0000 round-figure and then rush to the monthly top surrounding 1.0015/20. |
USD/CHF 4-hour chart(see more posts on USD/CHF, ) |
Trend: bearish
Tags: Featured,newsletter,USD/CHF

