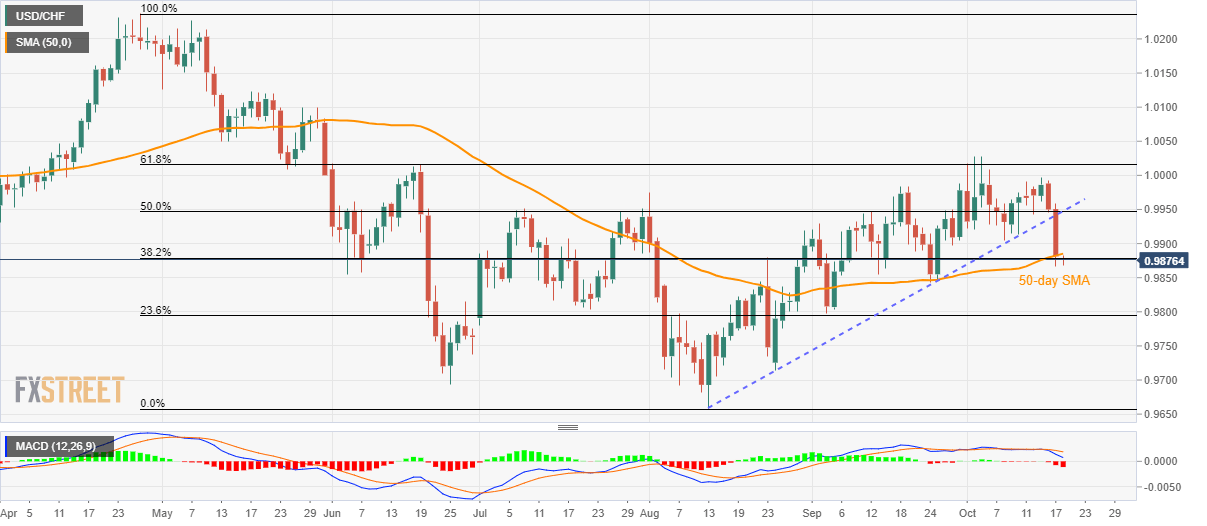
USD/CHF struggles around 38.2% Fibonacci retracement after declining to a three-week low. Bearish MACD favors further downpour to 0.9800/9795 support-zone. With its sustained trading below 50-day SMA, coupled with the bearish MACD, USD/CHF stays on the sellers’ radar even if it clings to 0.9880 during early Friday. The September 24 low nearing 0.9840 acts as immediate support for the pair while the previous month low and 23.6% Fibonacci retracement of April-August south-run, close to 0.9800/9795 support-zone, could restrict further downside. During the pair’s further weakness below 0.9795, 0.9715 and 0.9690 will become bears’ favorites. Should traders ignore a bearish signal from the 12-bar Moving Average Convergence and Divergence (MACD), they need to provide a
Topics:
Anil Panchal considers the following as important: 1.) FXStreet on SNB&CHF, 1) SNB and CHF, Featured, newsletter
This could be interesting, too:
Nachrichten Ticker - www.finanzen.ch writes Die Performance der Kryptowährungen in KW 9: Das hat sich bei Bitcoin, Ether & Co. getan
Nachrichten Ticker - www.finanzen.ch writes Wer verbirgt sich hinter der Ethereum-Technologie?
Martin Hartmann writes Eine Analyse nach den Lehren von Milton Friedman
Marc Chandler writes March 2025 Monthly
- USD/CHF struggles around 38.2% Fibonacci retracement after declining to a three-week low.
- Bearish MACD favors further downpour to 0.9800/9795 support-zone.
| With its sustained trading below 50-day SMA, coupled with the bearish MACD, USD/CHF stays on the sellers’ radar even if it clings to 0.9880 during early Friday.
The September 24 low nearing 0.9840 acts as immediate support for the pair while the previous month low and 23.6% Fibonacci retracement of April-August south-run, close to 0.9800/9795 support-zone, could restrict further downside. During the pair’s further weakness below 0.9795, 0.9715 and 0.9690 will become bears’ favorites. Should traders ignore a bearish signal from the 12-bar Moving Average Convergence and Divergence (MACD), they need to provide a daily closing beyond 50-day Simple Moving Average (SMA) surrounding 0.9885 to aim for last week’s low near 0.9905. However, odds of short-term weakness can’t be defied unless the pair rises back beyond 0.9947/50 confluence including a two-month-old rising trend line and 50% Fibonacci retracement. |
USD/CHF daily chart, April-October 2019(see more posts on USD/CHF, ) |
Trend: bearish
Tags: Featured,newsletter

