Pater Tenebrarum
My articles My siteAbout meMy booksMy videos
Follow on:TwitterFacebook
Seeking Alpha
Cycles and Sentiment Another recurring pattern consists of the seasonally strong period in gold around the turn of the year, which is bisected by a mid to late December interim low in the gold price. An additional boost can be expected in January and Feburary from the strong seasonal uptrend in silver and platinum group metals as well (to see the seasonal PGM charts, scroll down to our addendum to this recent article by Dimitri Speck). 10 tola cast bar made in Switzerland for Asian markets. - Click to enlarge Rallies in silver tend to be quite supportive for precious metals stock indexes, as silver stocks have an even higher beta than their gold brethren (note in this context that the XAU is the more broad-based
Topics:
Pater Tenebrarum considers the following as important: Chart Update, Featured, Gold and Bitcoin, newsletter, Precious Metals
This could be interesting, too:
Nachrichten Ticker - www.finanzen.ch writes Die Performance der Kryptowährungen in KW 9: Das hat sich bei Bitcoin, Ether & Co. getan
Nachrichten Ticker - www.finanzen.ch writes Wer verbirgt sich hinter der Ethereum-Technologie?
Martin Hartmann writes Eine Analyse nach den Lehren von Milton Friedman
Marc Chandler writes March 2025 Monthly
Cycles and SentimentAnother recurring pattern consists of the seasonally strong period in gold around the turn of the year, which is bisected by a mid to late December interim low in the gold price. An additional boost can be expected in January and Feburary from the strong seasonal uptrend in silver and platinum group metals as well (to see the seasonal PGM charts, scroll down to our addendum to this recent article by Dimitri Speck). |
 10 tola cast bar made in Switzerland for Asian markets. - Click to enlarge |
| Rallies in silver tend to be quite supportive for precious metals stock indexes, as silver stocks have an even higher beta than their gold brethren (note in this context that the XAU is the more broad-based of the two indexes these days and contains far more silver stocks than the HUI – see these lists of the current XAU and HUI constituents for details).
Below is the 20-year seasonal gold chart, with the period from the December 20 interim low to the late February peak highlighted. Note that the statistical data shown on the chart refer specifically to the highlighted period, which in turn is an average of the action at this time of the year over the past 20 years. Obviously, there are years in which no gain is achieved in the seasonally strong period, but over the past 20 years the probability that prices would rally was 70% (14:6 = 7:3). Moreover, while the gains in profitable years ranged from +8.52 to +17.98%, losses were much smaller, confined to a range of just -1.60 to -3.30%. Interestingly, even if one averages only the performance of bear market years (i.e., years which close at a y/y loss), the period of strength still shows up during January. We suspect this is due to the exceptional seasonal strength in silver during this time period, gold probably tends to rise in sympathy. |
Seasonal Gold Spot, Dec 2017 - 2018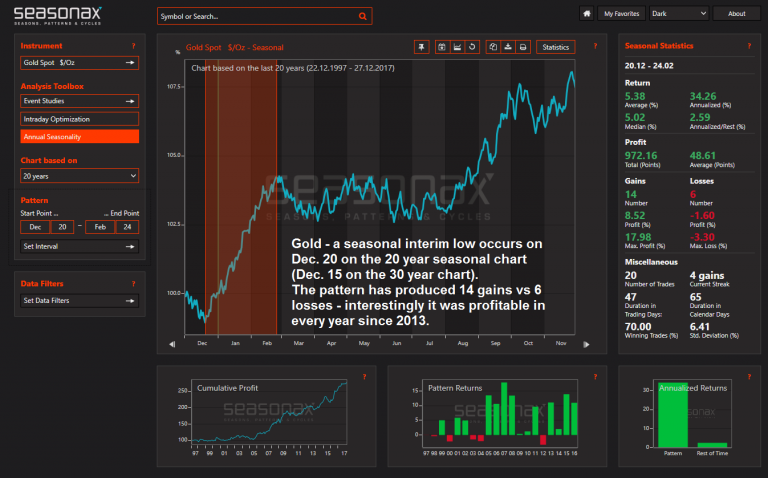 Gold, 20-year seasonal chart with all relevant statistics. - Click to enlarge The December interim low is close to the mid December Fed meeting, i.e., in recent years the seasonal pattern and the “FOMC relief rally” were going hand in hand |
| The 20-year seasonal chart of silver exhibits even more strength over a slightly longer time period starting on the same date: the probability of a rally is 80%, and the average gain is 9.39% (profits ranging from +12.90 to +42.92%), which is a stunning 58.70% annualized. |
Seasonal Silver Spot, Jun 2016 - May 2017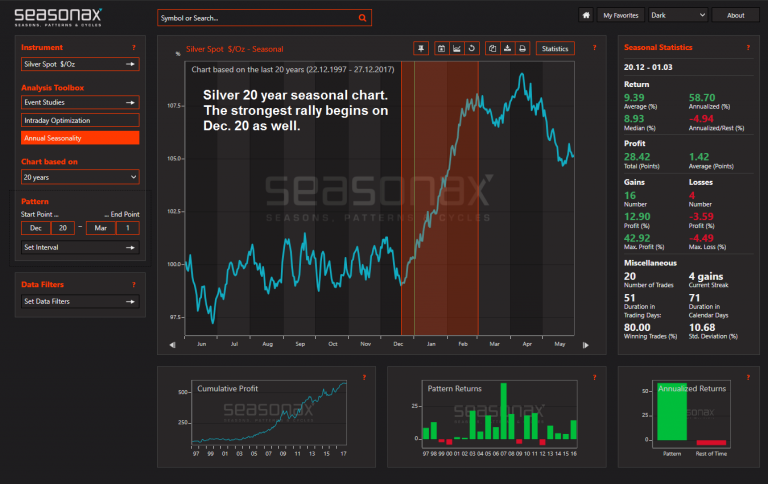 Note: regardless of how long the period chosen for the calculation is, the seasonally strong period in silver is always clearly visible and exceptionally large; it is even noticeable if one averages only bearish years. - Click to enlarge Apparently industrial users traditionally stock up at the beginning of the year. Strength in silver tends to particularly helpful for the performance of the XAU and HUI indexes. |
| By coincidence, a 13 ½ month gold time cycle discussed by Tom McClellan in this article also aligns very closely with the seasonal trend this year, as it bottoms in December. Here is a chart that shows this cycle. Note that both full and half-cycles apparently often tend to align with lows and occasionally consecutive lows “surround” the projected cycle low. In short, this is not the most precise of cycles. |
Gold Cycle Low Aligns - Jan 2011 - 2018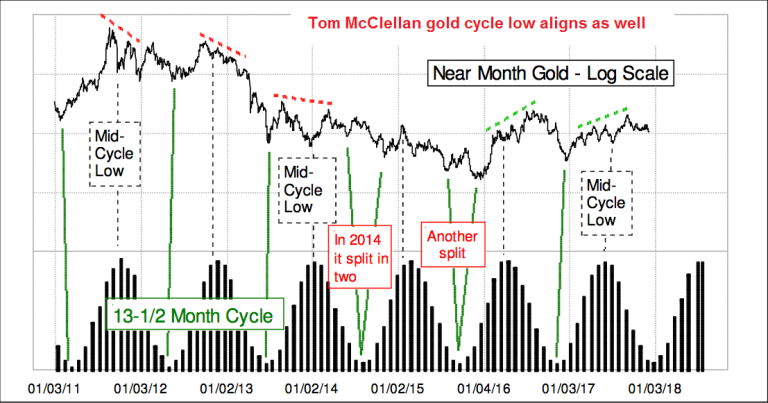 A gold time cycle followed by Tom McClellan – its 2017 trough is in the last week of December - Click to enlarge |
| Such “fixed” time cycles generally have less validity than seasonal patterns, but we thought it was interesting that this particular one happens to coincide with the December turning point in the seasonal trend and the other data points pointing to a December trend change this year.
Regarding sentiment, we want to mention two data points that stood out around the time of the mid-December low: a) just ahead of the FOMC meeting the second-lowest DSI reading of the year occurred (DSI= daily sentiment index of futures traders: 13% bulls – the lowest was 10% at the July low), and b) at the same time the sentimentrader Optix indicator (which combines positioning data in futures and options with the most prominent surveys) fell to 31 points – the lowest reading since early January of 2016. Sentiment data follow prices, which tends to limit their usefulness, especially in strongly trending markets. We have noticed that depending on whether a strong overarching uptrend or downtrend is underway, the range in which the Optix moves will shift up or down. Once one has a good idea of what this range is, one can expect that readings near its upper and/or lower bounds will at least lead to short term counter-trend moves, regardless of the primary trend. If the gold market moves sideways – as it has done over the past 1 ½ years – the Optix tends to be quite reliable as a short term contrary indicator. An extremely low (or high) reading that occurs near the boundaries of a sideways price range is usually associated with a medium to longer term opportunity. |
Gold Optix, Nov 2015 - 2017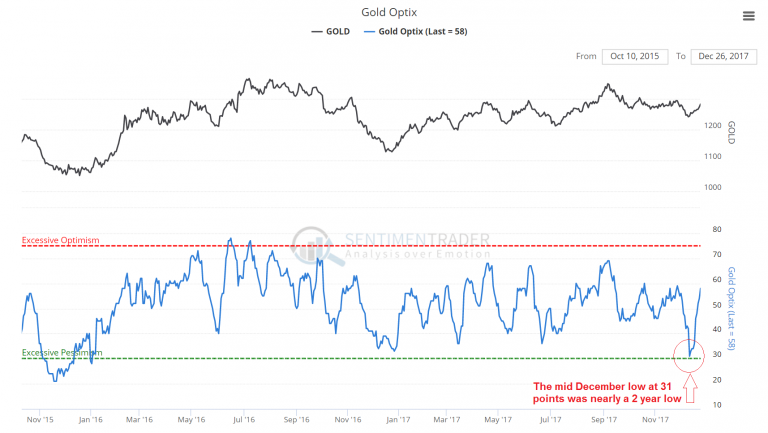 Gold Optix – not only was the reading of 31 points the lowest since 04 January 2016, it also indicated that bearish sentiment became more pronounced despite gold trading at a higher level than on previous occasions when the Optix reached short term lows this year. - Click to enlarge This can be interpreted as a bullish divergence. In fact, gold price/ Optix level divergences at lows are quite a common feature (interestingly, they are not as frequent at peaks). |
Insider ActivityWe have kept the best for last – this may well be the most interesting and encouraging of the data points we have discussed. As our friends at INK Research in Canada recently reported, lately insider buying at gold companies has basically “gone off the charts” compared to historical standards. |
Basic Materials and Gold Sentiment Indicator, Jan - Dec 2017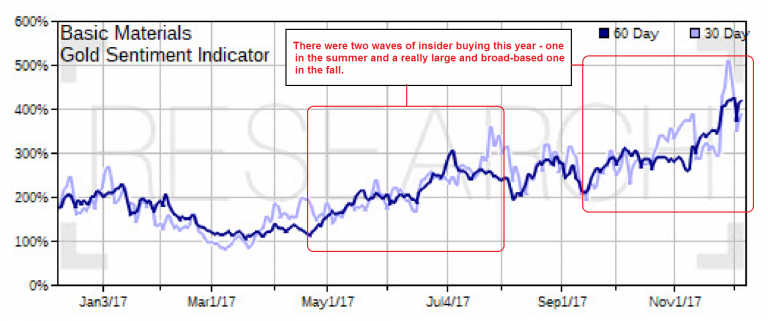 The spike in insider buying in the gold sector this fall (which went hand in hand with the decline in prices) was already the second one this year, but it attained extraordinary proportions. - Click to enlarge |
| There are several things worth noting here: first of all, insider buying in the gold sector is rare, especially outside of the exploration/ junior sub-sector. When exploration company insiders buy, it signals that they are confident in discoveries they have made and believe that investors have yet to realize what their true value is.
While explorers no doubt benefit from rising metal prices, they are not a sine qua non for their success – it is enough if prices manage to remain fairly stable. By way of example, if a company starts out with nothing but a hunch about where to drill, and it suddenly finds a million ounces of near-surface high-grade gold, it won’t matter much whether gold trades at $1,200 or $1,300 – a re-rating of the stock is certain to happen either way. Two things were remarkable about the recent surge in insider buying: for one thing, it was the biggest since the fall of 2015 (which was one of the most noteworthy such buying sprees in a long time as well). Secondly, it was quite broad-based: there was a lot of buying from insiders at senior and mid-tier producers. As an example, numerous Barrick Gold (ABX) insiders purchased sizable amounts of stock in the public markets (n.b.: it is best to consult Canadian filings, a number of US data providers are silent on the matter). Keep in mind that gold mining insiders have no special insight in future gold price trends. So what is the message when insiders at senior and mid-tier producers buy stock in the companies they run? Obviously their buying has to be based on what they do know and have control over. We would take it as a sign that the trend toward better cost control and improving margins continues apace, and insiders evidently believe the market is still underestimating it. Lastly, gold mining insiders have definitely proved savvy with respect to their timing in recent years. Their purchases from mid to late 2015 were certainly amply rewarded, and they actually happened to catch at least a short term low this summer as well. In any case, it is definitely worth paying heed when they buy as much as they recently have – one would normally expect this to be at least of medium term significance. |
ABX Daily, Feb 2016 - Dec 2017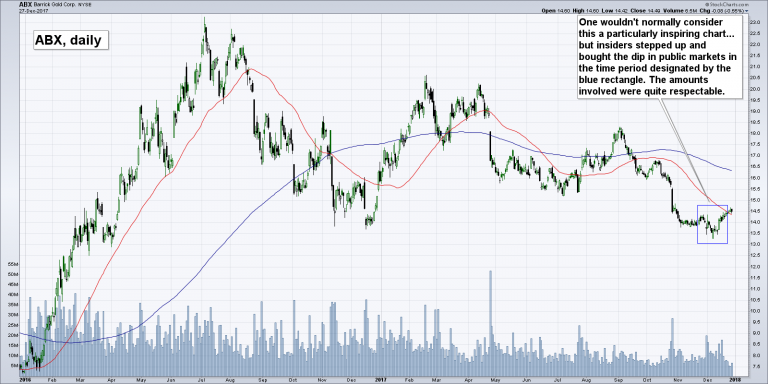 ABX, daily over the past two years. - Click to enlarge The chart pattern is of course reminiscent of the HUI pattern, only it looks actually a bit weaker. Since April the declines seem to be a lot more vigorous than the bounces. Insiders have bought the stock hand over fist between late November and late December though – presumably the chart will soon improve |
ConclusionTo summarize: chart patterns, seasonal trends and cycles, sentiment and insider buying all paint a fairly positive picture for the gold sector at the moment. This should at least be good enough to support a short term move higher, and perhaps more. However, as we noted at the beginning of Part 1, things are never as clear-cut as one would like. One fly in the ointment is the fact that the major fundamental gold price drivers are not exactly bullishly aligned right now. Similar to what we observed earlier this year already, they are at best in a neutral or slightly bearish position. That said, they are pregnant with possibilities (i.e., they all could quite easily turn bullish in view of the increasingly hostile monetary backdrop). We will discuss fundamentals and inter-market relationships relevant to gold in a follow-up post shortly. |
 Moribund gold bug hoping for better times. - Click to enlarge |
Tags: Chart Update,Featured,newsletter,Precious Metals