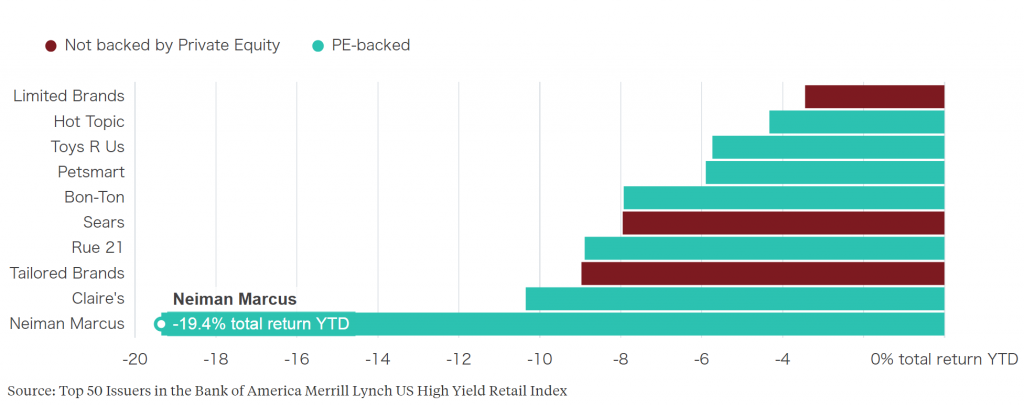
Retail Debt Debacles The retail sector has replaced the oil sector in a sense, and not in a good way. It is the sector that is most likely to see a large surge in bankruptcies this year. Junk bonds issued by retailers are performing dismally, and within the group the bonds of companies that were subject to leveraged buyouts by private equity firms seem to be doing the worst (a function of their outsized debt loads). Here is a chart showing the y-t-d performance of a number of these bonds as of the end of March: Note the stand-out Neiman Marcus, a luxury apparel retailer, the bonds of which have been in free-fall this year. The company was bought out in an LBO and was saddled with a mountain of debt in the process. Investors buying this debt have now come to regret their purchases, particularly as it is debt of the “creative” kind. Investor demand for junk bonds continues to be brisk, with inflows from retail investors said to be particularly strong. As we have pointed out on previous occasions, this surge in demand has resulted in creditors accepting ever softer loan covenants.
Topics:
Pater Tenebrarum considers the following as important: Central Banks, Debt and the Fallacies of Paper Money, Featured, newsletter, On Economy
This could be interesting, too:
Nachrichten Ticker - www.finanzen.ch writes Die Performance der Kryptowährungen in KW 9: Das hat sich bei Bitcoin, Ether & Co. getan
Nachrichten Ticker - www.finanzen.ch writes Wer verbirgt sich hinter der Ethereum-Technologie?
Martin Hartmann writes Eine Analyse nach den Lehren von Milton Friedman
Marc Chandler writes March 2025 Monthly
Retail Debt DebaclesThe retail sector has replaced the oil sector in a sense, and not in a good way. It is the sector that is most likely to see a large surge in bankruptcies this year. Junk bonds issued by retailers are performing dismally, and within the group the bonds of companies that were subject to leveraged buyouts by private equity firms seem to be doing the worst (a function of their outsized debt loads). Here is a chart showing the y-t-d performance of a number of these bonds as of the end of March: Note the stand-out Neiman Marcus, a luxury apparel retailer, the bonds of which have been in free-fall this year. The company was bought out in an LBO and was saddled with a mountain of debt in the process. Investors buying this debt have now come to regret their purchases, particularly as it is debt of the “creative” kind. Investor demand for junk bonds continues to be brisk, with inflows from retail investors said to be particularly strong. As we have pointed out on previous occasions, this surge in demand has resulted in creditors accepting ever softer loan covenants. |
Retail Junk Debt, April 2017 |
| A long period of extremely low interest rates not only leads to a pronounced distortion of relative prices and the associated malinvestment of capital, it also tends to make a growing number of debtors increasingly vulnerable to rising rates and other disruptions. Over time, the number of companies forced to regularly roll over debt if they want to remain among the quick will inevitably increase.
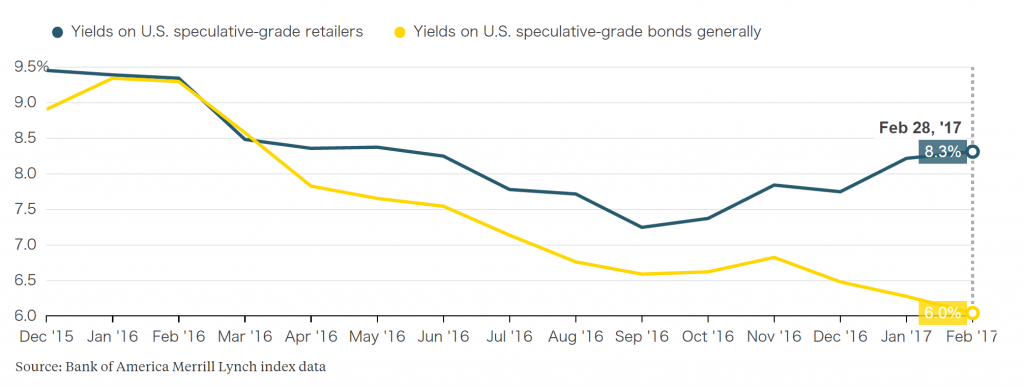
These companies then depend on high investor confidence, which is now faltering in the retail sector. The out look seems appropriately grim: Fitch expects the default rate in the sector to spike to 9% this year. |
U.S Yield Comparison, December 2015 - February 2017 |
Ponzi InstrumentsOne of the innovations created in order to exploit the mindless yield-chasing by investors are so-called PIK toggle bonds (PIK= payment in kind), which essentially represent Ponzi finance instruments. The term “Ponzi finance” was coined by post-Keynesian economist Hyman Minsky. We think his financial instability hypothesis is descriptive rather than explanatory, but we don’t want to focus on Minsky’s theory. Still, it is at least worth noting in passing that he ultimately argued in favor of even more government intervention, so he basically just recast the old “market failure” fairy tale. |
|
| Anyway, Minsky differentiated between three types of borrowers one can observe in the “stable” period (i.e., in the boom phase): 1. hedge borrowers, who are able to meet all their debt obligations from cash flows; 2. speculative borrowers, able to pay interest out of their cash flows, but unable to meet redemptions of principal without issuing new debt; and 3. “Ponzi borrowers”, who aren’t even able to meet interest payments on their debt without issuing more debt.
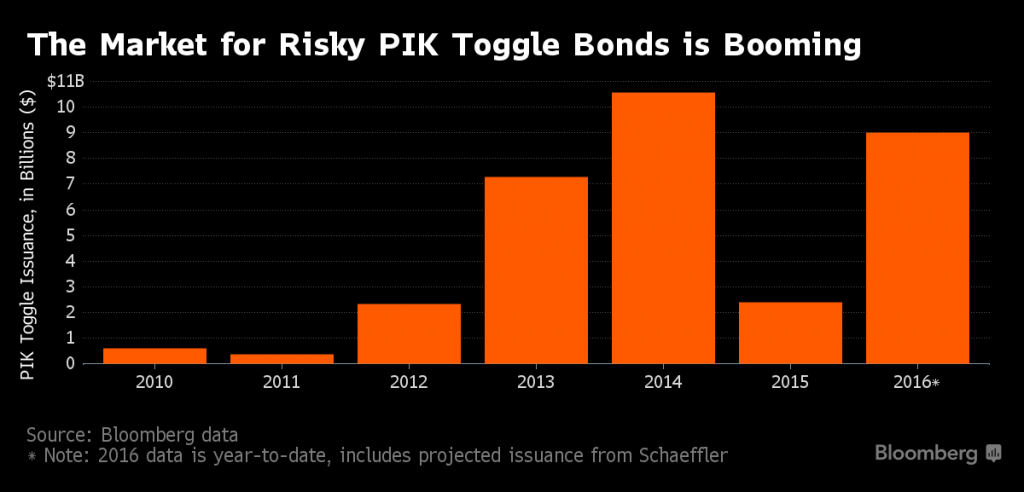
In this sense, PIK toggle bonds are clearly instruments of Ponzi finance. Issuance of PIK bonds briefly stalled in 2015, presumably because concerns over China’s declining foreign exchange reserves and rising stock market volatility spooked investors. It recovered with a vengeance in 2016: |
PIK Toggle Issuance, 2010 - 2016 |
As their name indicates, these bonds allow issuers to choose whether they want to pay interest in cash, or by simply issuing more of the same bonds to bondholders. Once the second option is chosen, one can be fairly certain that the issuer is in trouble or fears he soon will be, and is scrambling to preserve short term liquidity. And that is precisely what Neiman Marcus has just done. As Marketwatch informs us:
(emphasis added) |
|
| Perhaps Neiman Marcus serves as a kind of canary in the coal mine for the retail sector now (or at least the apparel sub-sector), but this is not the first time it has used the “toggle” function of its PIK bonds. What makes this instance stand out a bit is that it happens after a very persistent downtrend in same-store sales (five quarters in a row).
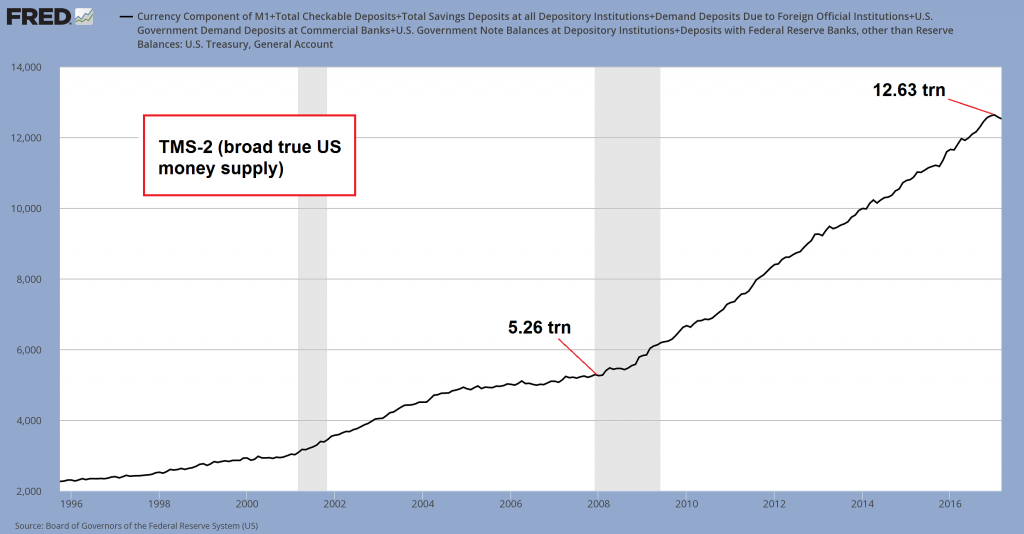
As the first chart shows, apparel chains are evidently not the only brick and mortar retailers in trouble. Moreover, if the default rate forecast by Fitch turns out to be correct, there should be a significant impact on the commercial real estate business down the road. A great many shopping malls are bound to turn out to be surplus to requirements. As an aside to this, we suspect that quite a few office towers will eventually become obsolete as well. Clusters of ErrorsIn the excerpt from the Marketwatch article above it is inter alia pointed out that the company and many of its peers are “struggling with changes impacting the industry”. That almost sounds like a report on a ship that is about to capsize because its crew was surprised by inclement weather and high waves. That is not really the case here though; these problems are not akin to a natural catastrophe. Whenever large clusters of business errors emerge in a sector of the economy, one must wonder how this is even possible (that applies to the recent problems in the energy sector as well). Are that many businessmen and investors involved in the sector so bereft of foresight that they could not see this coming? That seems rather unlikely; it seems far more likely that their decisions were somehow led astray. The culprit at the top of our list is the fact that in the past eight years alone, the Federal Reserve has aided and abetted the creation of ~7.35 trillion dollars in new money in addition to the 5.3 trillion dollars that existed in early 2008. |
TMS - 2 Broad True US Money Supply, 1996 - 2016(see more posts on U.S. Money Supply, ) |
| US broad true money supply TMS-2: when the money supply is expanded by 140% in eight years, stuff happens. It feels good at first, but illusory profits and phantom wealth always disappear down the road, one way or another – click to enlarge.
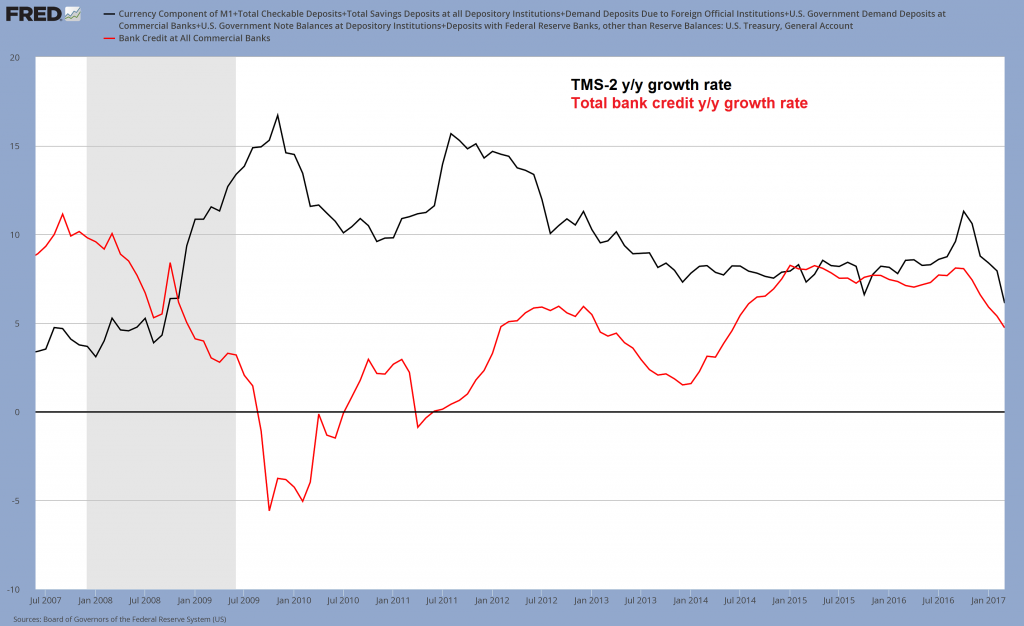
As we have recently discussed, money supply growth is currently falling quite rapidly – we expected growth in the broad true money supply to follow the lead of AMS, and that is now indeed happening. Without QE, money supply expansion has become relinked to growth in commercial bank credit, which is rapidly declining lately – and money supply growth has followed suit. We have to expect a further slowdown in economic activity in coming months as bubble activities begin to be liquidated (bubble activities are economic activities that would not take place without monetary pumping, as they are not really profitable). Year-on-year growth rate of TMS-2 and total bank credit. The current TMS-2 growth rate of 6.12% is the lowest since October 2008, when the Fed’s various debt monetization schemes began to take off – click to enlarge. ConclusionMore errors will likely be unmasked as the year progresses. Not only that, it seems we will finally find out what threshold in the money supply growth rate needs to be undercut in the post-QE era for the bubble in asset prices to burst. PS: The fact that the companies with the biggest problems were taken over in LBOs by private equity firms is a topic we will discuss in more detail a separate post. We can tell you already though that the data indicate that in the not-too-distant future many investors are going to feel as though they have been transported to hell and eventually, even Crispin Odey’s loneliness will end. Charts by: Bloomberg, St. Louis Fed |
TMS-2 Total Bank Credit Y/Y Growth, July 2007 - January 2017 |
Tags: central banks,Featured,newsletter,On Economy

