Summary:
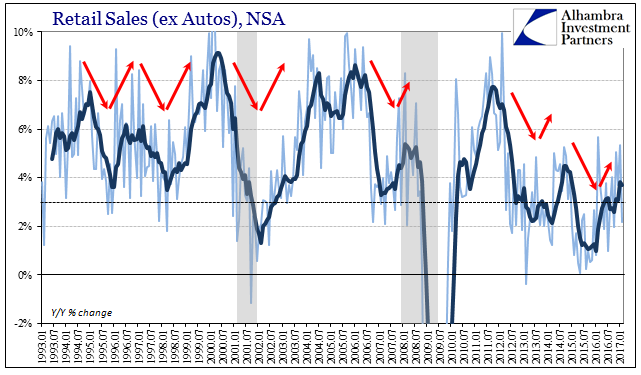
Retail sales comparisons were for February 2017 skewed by the extra day in February 2016. With the leap year February 29th a part of the base effect, the estimated growth rates (NSA) for this February are to some degree better than they appear. Seasonally-adjusted retail sales were in the latest estimates essentially flat when compared to the prior month (January). That leaves too much guesswork to draw any hard conclusions. Retail Sales, Jan 1993 - 2017 - Click to enlarge Once the data for March 2017 is collected and reported, we can, like Chinese figures comparing dissimilar calendar quirks, make more reasonable determinations about the state of the consumer. The tentative view of February retail sales is somewhere between the same and somewhat less. Retail Trade, 1993 - 2017 - Click to enlarge What appears the same is the oil price effect running through retail sales registered by gasoline stations. That category of sales was up just about 16% year-over-year after rising almost 14% in January. From this view it would seem the calendar effect of February leap year to February not is perhaps less than otherwise suggested. Total retail sales, including auto sales, minus gasoline rose by just 1.1%. The 6-month average is down to 3.
Topics:
Jeffrey P. Snider considers the following as important: Auto Sales, consumer spending, currencies, department store sales, depression, economy, Featured, february, Federal Reserve/Monetary Policy, gasoline, leap year, Markets, newslettersent, non-store retail sales, oil prices, online sales, Retail sales, The United States
This could be interesting, too:
Nachrichten Ticker - www.finanzen.ch writes Die Performance der Kryptowährungen in KW 9: Das hat sich bei Bitcoin, Ether & Co. getan
Nachrichten Ticker - www.finanzen.ch writes Wer verbirgt sich hinter der Ethereum-Technologie?
Marc Chandler writes March 2025 Monthly
Mark Thornton writes Is Amazon a Union-Busting Leviathan?
| Retail sales comparisons were for February 2017 skewed by the extra day in February 2016. With the leap year February 29th a part of the base effect, the estimated growth rates (NSA) for this February are to some degree better than they appear. Seasonally-adjusted retail sales were in the latest estimates essentially flat when compared to the prior month (January). That leaves too much guesswork to draw any hard conclusions. |
Retail Sales, Jan 1993 - 2017 |
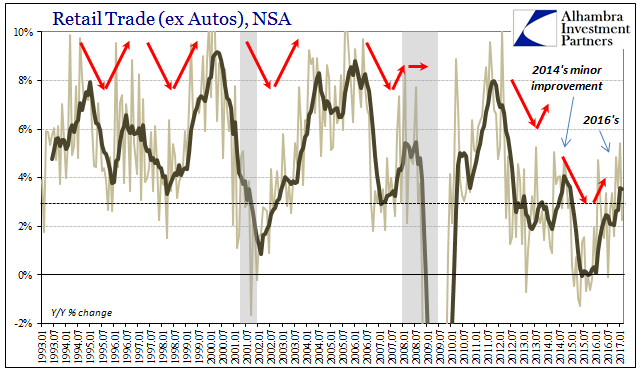
| Once the data for March 2017 is collected and reported, we can, like Chinese figures comparing dissimilar calendar quirks, make more reasonable determinations about the state of the consumer. The tentative view of February retail sales is somewhere between the same and somewhat less. |
Retail Trade, 1993 - 2017 |
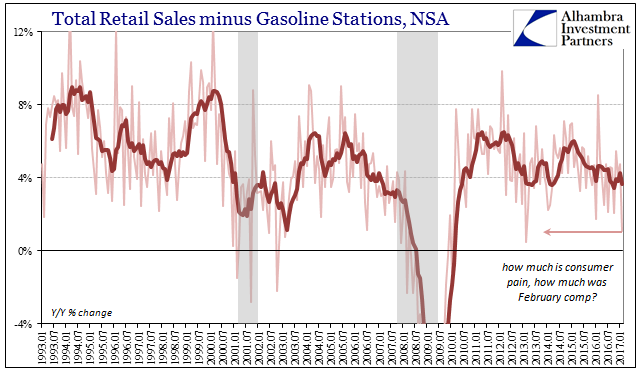
| What appears the same is the oil price effect running through retail sales registered by gasoline stations. That category of sales was up just about 16% year-over-year after rising almost 14% in January. From this view it would seem the calendar effect of February leap year to February not is perhaps less than otherwise suggested. Total retail sales, including auto sales, minus gasoline rose by just 1.1%. The 6-month average is down to 3.7%, still among the weakest averages of this post-Great “Recession” period, or any other prior period for that matter. |
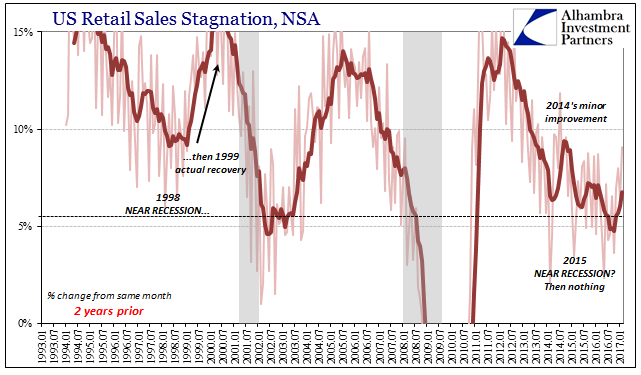
US Retail Sales Stagnation, 1993 - 2017 |
| It is the average rate that matters more than any single month, including the growth rate for February. Had the sales gain been the same this month as last month, the 6-month average would have also been the same, meaning still unusually and consistently weak. |
Total Retail Sales minus Gasoline Stations, Jan 1993 - 2017 |
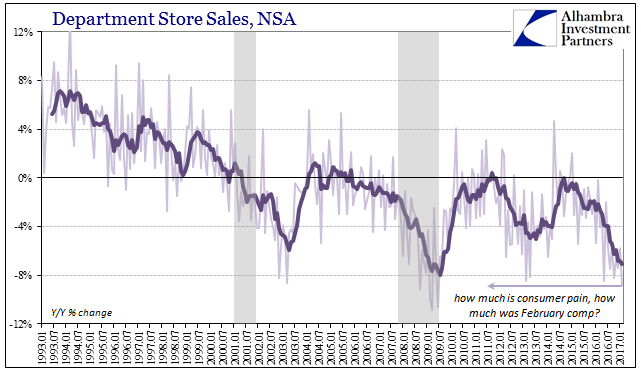
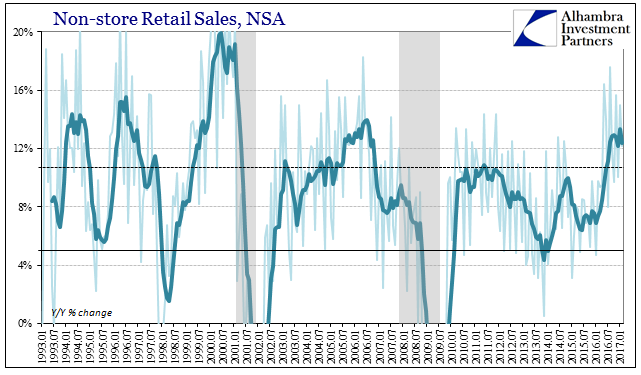
| Non-store retail sales increased by 12.2%, which was right about average and thus suggesting that either the one fewer day this February was again a small factor or that non-store sales would have been considerably better on like calendar terms. Either way, it is still the same trade-off to where online outlets have been booming at the same time “brick and mortar” channels have fallen into serious trouble. Department Store sales were down 8.8%, the worst month since 2009. Though sales on a calendar basis were in all likelihood not that bad, is there truly a difference between the worst since 2009 and among the worst since 2009? |
Retail Sales Department Store, Jan 1993 - 2017 |
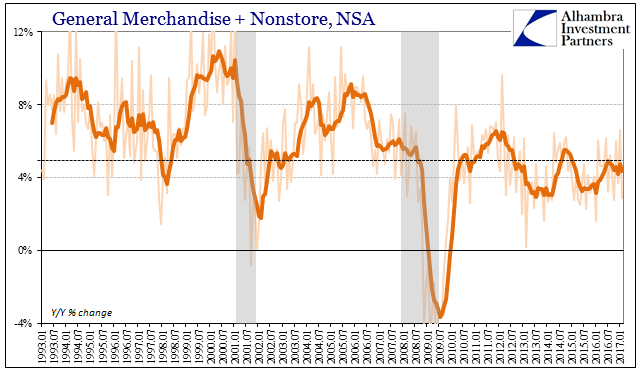
| Combining Non-store sales with those at General Merchandise stores, the growth rate remains the same low level as it has been going back to the slowdown in 2012 around the announcement of QE3 in September that year. The difference of last year’s monthly length is minor considering this context. |
Retail Sales Non-Store, Jan 1993 - 2017 |
| Retail sales (ex autos) with the extra day in February 2016 were up almost 6% from the 28-day February in 2015. Comparing retail sales in the 28-day February 2017 to the 28-day February 2015 we get just 7.9% growth, total. In the late stages of the housing bubble (2004-2006), retail sales (ex autos) averaged 7.5% in just one-year comparisons; from 1999 and the rebound from the near recession inspired by the Asian flu to the doorstep of the dot-com recession in early 2001, the single-year average was 7.4%. We know consumer spending remains weak, but for February 2017 we don’t know enough by how much. |
Retail Sales Nonstore, Jan 1993 - 2017 |
Tags: Auto Sales,consumer spending,currencies,department store sales,depression,economy,Featured,february,Federal Reserve/Monetary Policy,gasoline,leap year,Markets,newslettersent,non-store retail sales,oil prices,online sales,Retail sales

