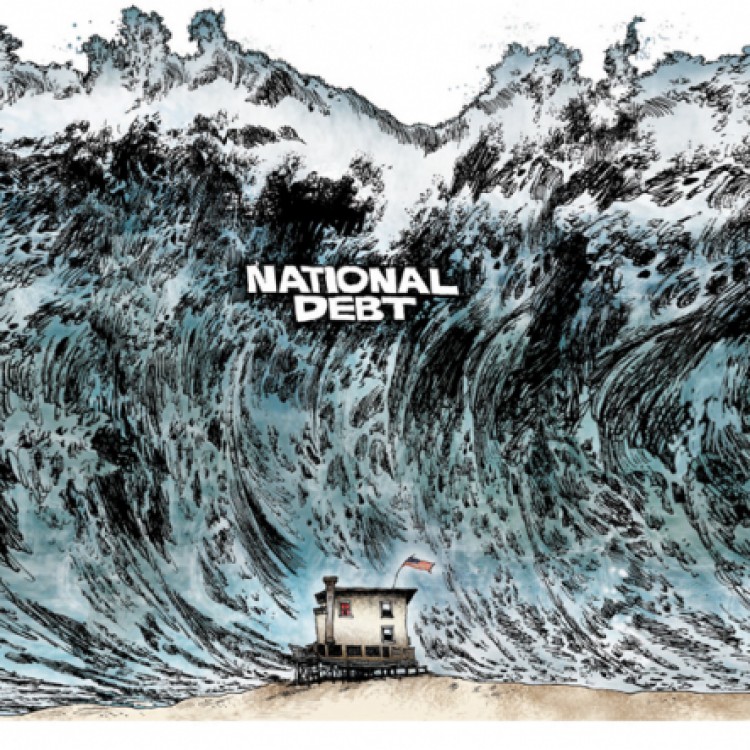
One Ear to the Ground, One Eye to the Future Treasury yields are attempting to say something. But what it is exactly is open to interpretation. What’s more, only the most curious care to ponder it. Like Southern California’s obligatory June Gloom, what Treasury yields may appear to be foreshadowing can be somewhat misleading. Behold, the risk-free tide… - Click to enlarge Are investors anticipating deflation or inflation? Are yields adjusting to some other market or external phenomenon, perhaps central bank intervention? So far this year, and in the face of the much-ballyhooed prospect of Trumpflation, the yield on the 10-Year note has gone down. Not up. On January 1st, the 10-Year note yielded 2.44 percent.
Topics:
MN Gordon considers the following as important: Debt and the Fallacies of Paper Money, Featured, newsletter, On Economy
This could be interesting, too:
Nachrichten Ticker - www.finanzen.ch writes Die Performance der Kryptowährungen in KW 9: Das hat sich bei Bitcoin, Ether & Co. getan
Nachrichten Ticker - www.finanzen.ch writes Wer verbirgt sich hinter der Ethereum-Technologie?
Martin Hartmann writes Eine Analyse nach den Lehren von Milton Friedman
Marc Chandler writes March 2025 Monthly
One Ear to the Ground, One Eye to the FutureTreasury yields are attempting to say something. But what it is exactly is open to interpretation. What’s more, only the most curious care to ponder it. Like Southern California’s obligatory June Gloom, what Treasury yields may appear to be foreshadowing can be somewhat misleading. |
 Behold, the risk-free tide… - Click to enlarge |
| Are investors anticipating deflation or inflation? Are yields adjusting to some other market or external phenomenon, perhaps central bank intervention?
So far this year, and in the face of the much-ballyhooed prospect of Trumpflation, the yield on the 10-Year note has gone down. Not up. On January 1st, the 10-Year note yielded 2.44 percent. As of market close Thursday, the yield was 2.22 percent. At first glance, it appears there’s nary a care in the world about inflation. Conjecture, says there’s an expectation that Trump will be unsuccessful at getting his spending bill through Congress. Without Trump’s fiscal stimulus, goes the thinking, the potential for inflation becomes muted. In reality, does this have anything to do with anything? What are Treasury yields really trying to say? To be clear, contemplating Treasury yields is like a baker contemplating the microbiology of bread yeast. The proper technique is imprecise, and best garnered over time through learned experience. We’ve found the best results for drawing an inkling from Treasury yields are obtained by putting one ear to the ground and one eye to the future. Here’s what we mean… |
U.S. Treasure Yield Index, October 2016 - June 2017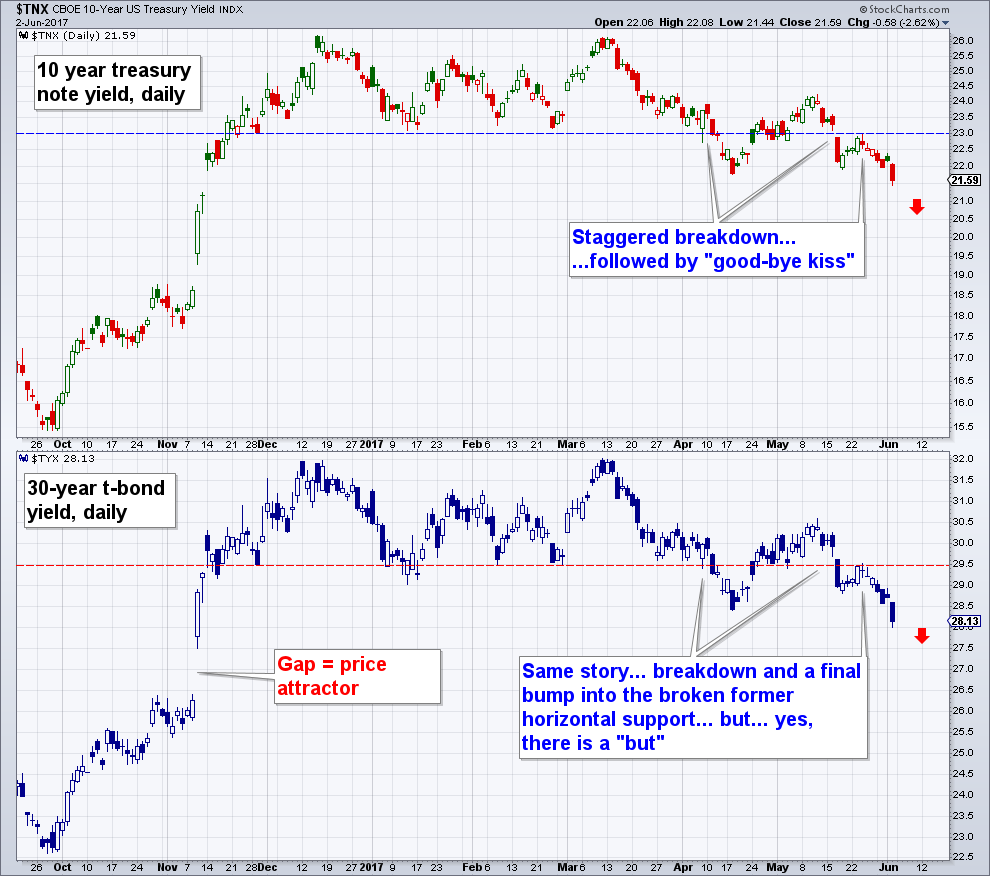 - Click to enlarge |
A Flattening Yield CurveIf you plot the interest rates of Treasuries with different maturity dates you get a graph showing something that economist and banker types call a ‘yield curve.’ For example, if you plotted three-month, two-year, five-year, and 30-year Treasury debt you’d have a yield curve that is often used as a benchmark for establishing various lending rates. More importantly, you can use the shape of the yield curve to forecast changes in economic growth. When everything’s just great with the economy, a normal yield curve, showing longer maturity Treasuries with a higher yield than shorter-term Treasuries, will appear. This reflects the potential for greater market risk, and inflation, further out into the future. |
Yield Curve, June 2016 - June 2017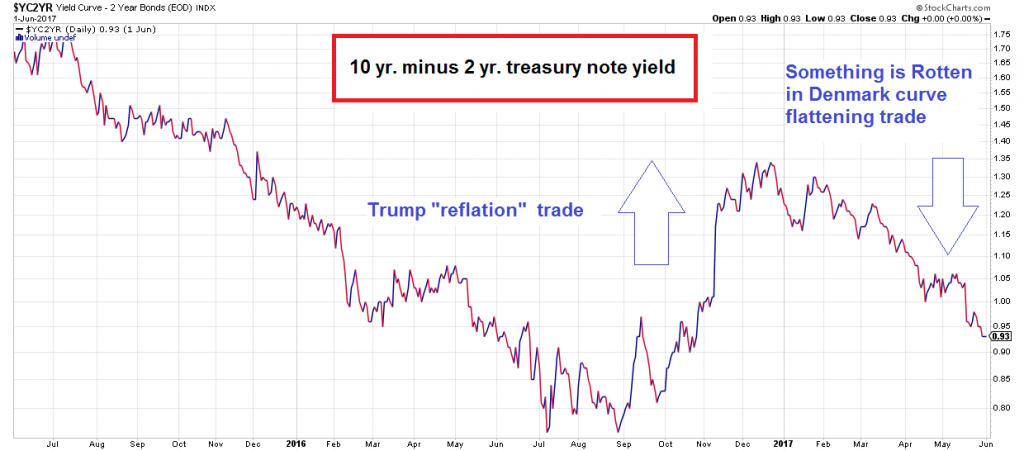 - Click to enlarge |
However, prior to a recession the yield curve often becomes inverted, with shorter-term yields higher than longer-term yields. Presently, the Treasury yield curve is flattening. Could it be transitioning to an inverted curve? Here we turn to FXSTREET for instruction:
|
Japan Yield Curve, 1990 - 2017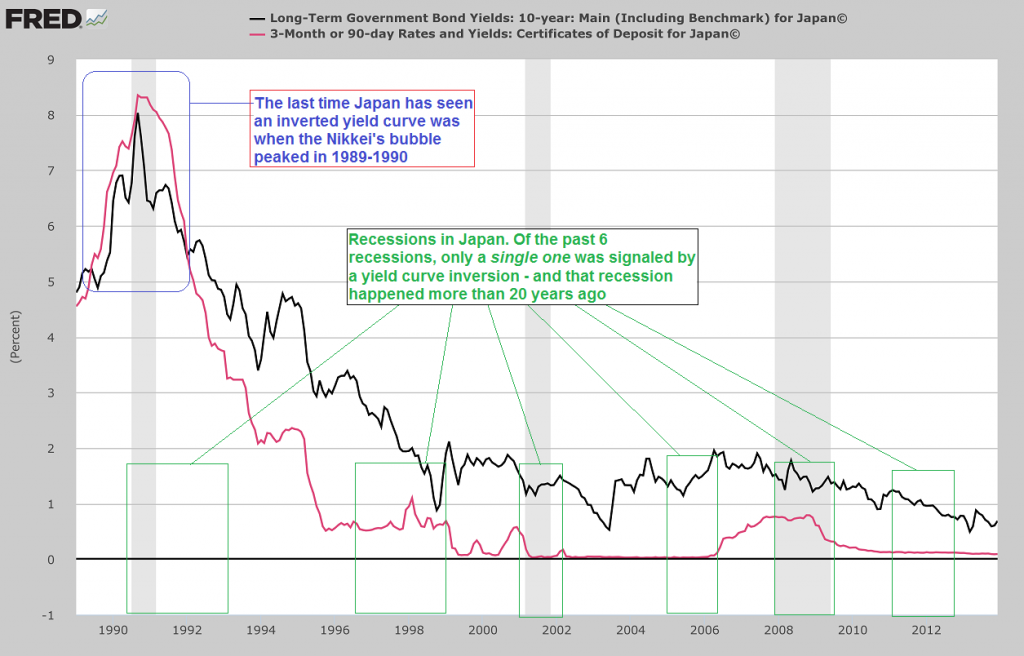 - Click to enlarge |
Recession Watch Fall 2017Hence, according to the Treasury market, economic growth may be stalling out. The Great Recession officially ended in June 2009. Yet the recovery has not been equally great. In fact, the recovery has been greatly feeble; it has hardly been discernible to the broad population. The unemployment rate may have come down. GDP may have inched up. Incomes may have even returned to where they were at the turn of the new millennium. But the wealth has generally concentrated with a small few, while everyone else has been left to fight over bread crumbs. Moreover, unemployment, GDP, and incomes have all been blown about by the Fed’s odorous monetary gas. Specifically, this is the same monetary gas that huffed and puffed up stock market and real estate prices, and suppressed interest rates. So, too, this is the same monetary gas that the Fed has been incapable of weaning the economy from. Could it be that we’re facing the prospects of another recession prior to the completion of Fed ‘normalization’ policies? From our one ear to the ground one eye to the future vantage point you can already count on it. Of course, many of the conditions that presaged the last recession – high levels of public and private debt, and asset bubbles – still exist today. Only in many instances they’re even larger. Naturally, the foolish attempt to solve a debt problem with more debt has now set us up for a much larger crisis and recession. At the moment, this forthcoming recession is popping up like dark storm clouds just above the horizon. By fall, it may be bearing down upon us in full force. |
 - Click to enlarge |
Tags: Featured,newsletter,On Economy