A Loss of Momentum Photo credit: R.P. Visual The price of gold moved down slightly this week, while that of silver dropped more substantially—1.9%. We don’t see much decrease in the enthusiasm yet from this minor setback. This was a shortened week due to the May Day holiday outside the US. Let’s look at the only true picture of supply and demand fundamentals. Gold and silver prices. First, here’s the graph of the metals’ prices. Gold and silver prices – click to enlarge. Next, Gold-silver ratio. this is a graph of the gold price measured in silver, otherwise known as the gold to silver ratio. The ratio was up over a point this week. Gold-silver ratio – click to enlarge. For each metal, we will look at a graph of the basis and co-basis overlaid with the price of the dollar in terms of the respective metal. It will make it easier to provide brief commentary. The dollar will be represented in green, the basis in blue and cobasis in red. Here is the gold graph. Gold basis and co-basis and the dollar price. Gold basis and co-basis and the dollar price – click to enlarge. We had to expand the range of the basis axis. The basis ended the week up, and the co-basis ended down. However, those spikes on Wednesday are really remarkable. It may just be a one-off event (though even that raises some questions about market liquidity).
Topics:
Keith Weiner considers the following as important: Featured, Gold, Gold and its price, newsletter, Precious Metals, silver, USD
This could be interesting, too:
Nachrichten Ticker - www.finanzen.ch writes Die Performance der Kryptowährungen in KW 9: Das hat sich bei Bitcoin, Ether & Co. getan
Nachrichten Ticker - www.finanzen.ch writes Wer verbirgt sich hinter der Ethereum-Technologie?
Martin Hartmann writes Eine Analyse nach den Lehren von Milton Friedman
Marc Chandler writes March 2025 Monthly
A Loss of Momentum
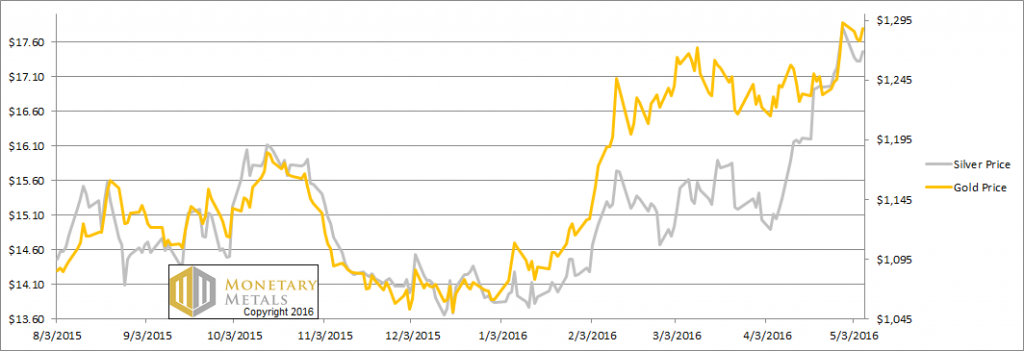
The price of gold moved down slightly this week, while that of silver dropped more substantially—1.9%. We don’t see much decrease in the enthusiasm yet from this minor setback.
This was a shortened week due to the May Day holiday outside the US.
Let’s look at the only true picture of supply and demand fundamentals.
Gold and silver prices.First, here’s the graph of the metals’ prices. |
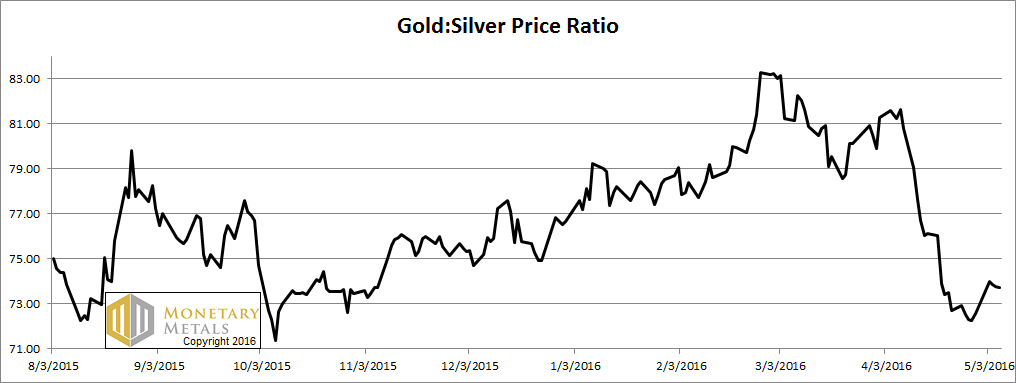
Next,
Gold-silver ratio.this is a graph of the gold price measured in silver, otherwise known as the gold to silver ratio. The ratio was up over a point this week. |
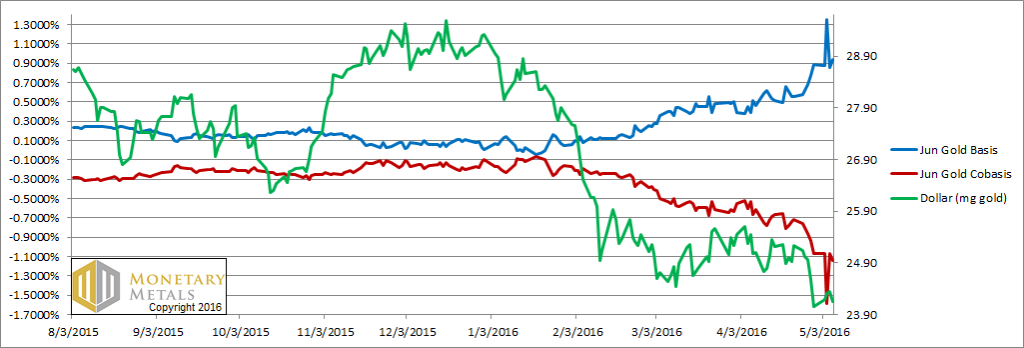
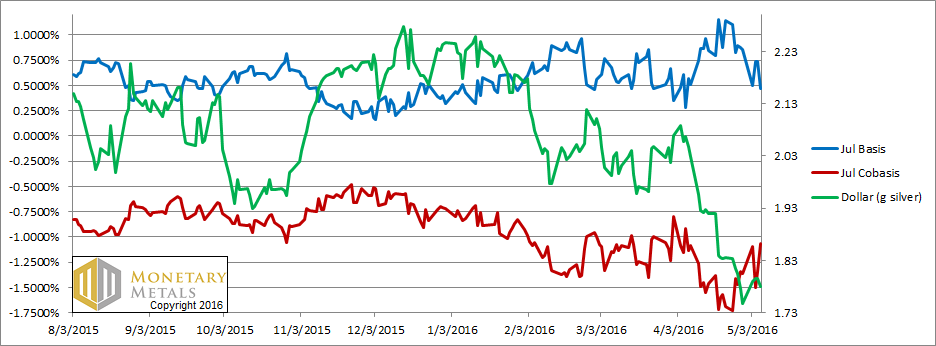
For each metal, we will look at a graph of the basis and co-basis overlaid with the price of the dollar in terms of the respective metal. It will make it easier to provide brief commentary. The dollar will be represented in green, the basis in blue and cobasis in red.
Here is the gold graph.
Gold basis and co-basis and the dollar price. |
We had to expand the range of the basis axis. The basis ended the week up, and the co-basis ended down. However, those spikes on Wednesday are really remarkable. It may just be a one-off event (though even that raises some questions about market liquidity).
Our calculated fundamental price is up a few dollars, but it is still more than $40 below the market price.
We just are not seeing the driver of a bull market in gold. Does that mean the price cannot rise further, driven by speculative greed? No, of course not. It just means that the supply and demand fundamentals are weak, as weak as we have seen them in years.
As recently as the first week of March, gold was selling at a $200 discount to its fundamental price. Supply and demand conditions have eroded, and recently the market price has risen above this lower fundamental price.
Now let’s turn to silver.
Silver basis an co-basis and the dollar price. |
In silver, the price is down and abundance (blue line) is down as well.
It does seem a bit anomalous that silver is showing relatively less weak fundamentals than gold. We shall see if this trend has legs.
Unsurprisingly, the fundamental price of silver went up. It is now only $1.50 below the market price.
The fundamental gold-silver ratio is 78.
Charts by: Monetary Metals
Dr. Keith Weiner is the president of the Gold Standard Institute USA, and CEO of Monetary Metals. Keith is a leading authority in the areas of gold, money, and credit and has made important contributions to the development of trading techniques founded upon the analysis of bid-ask spreads. Keith is a sought after speaker and regularly writes on economics. He is an Objectivist, and has his PhD from the New Austrian School of Economics. He lives with his wife near Phoenix, Arizona.
Previous post


