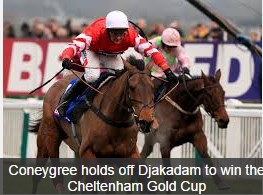
Consider the sport of betting on the sport of horse racing. It’s actually similar to the analysis of the gold and silver markets. How’s that? The Gold Cup Horses First, there is the manic-depressive crowd. Sometimes (as we are told—we don’t hang out at race tracks) the bettors sometimes get overly excited about a horse with slim chances to win, or get totally unexcited about a strong horse. The track responds by lowering or raising the payout for winning, respectively. The more betting on a horse, the lower the payout. The track does not care which horse is likely to win or not win. What it wants to do is take its rake from the total bets placed. It does this by making a spread between what it takes in on all the horses, and what it will have to pay out if any given horse wins. We don’t know the precise formula, but if horse X gets ¼ of the total bets then the payout if X wins had better be less than 4:1. In keeping with our theme of emphasizing spread rather than price, there is a spread that smart bettors should be paying attention to. A smart horse bettor should have a way of assessing the probability of X winning (and for every other horse in the race). He should bet when the payout is higher than the probability of winning. Suppose in the frenzy of betting on X, almost no one bets on Y. So Y pays 10:1. If a bettor assesses Y’s odds as 5:1, it’s a good bet.
Topics:
Keith Weiner considers the following as important: Featured, Gold and its price
This could be interesting, too:
Nachrichten Ticker - www.finanzen.ch writes Die Performance der Kryptowährungen in KW 9: Das hat sich bei Bitcoin, Ether & Co. getan
Nachrichten Ticker - www.finanzen.ch writes Wer verbirgt sich hinter der Ethereum-Technologie?
Marc Chandler writes March 2025 Monthly
Mark Thornton writes Is Amazon a Union-Busting Leviathan?
Consider the sport of betting on the sport of horse racing. It’s actually similar to the analysis of the gold and silver markets. How’s that?
First, there is the manic-depressive crowd. Sometimes (as we are told—we don’t hang out at race tracks) the bettors sometimes get overly excited about a horse with slim chances to win, or get totally unexcited about a strong horse. The track responds by lowering or raising the payout for winning, respectively. The more betting on a horse, the lower the payout.
The track does not care which horse is likely to win or not win. What it wants to do is take its rake from the total bets placed. It does this by making a spread between what it takes in on all the horses, and what it will have to pay out if any given horse wins. We don’t know the precise formula, but if horse X gets ¼ of the total bets then the payout if X wins had better be less than 4:1.
In keeping with our theme of emphasizing spread rather than price, there is a spread that smart bettors should be paying attention to. A smart horse bettor should have a way of assessing the probability of X winning (and for every other horse in the race). He should bet when the payout is higher than the probability of winning. Suppose in the frenzy of betting on X, almost no one bets on Y. So Y pays 10:1. If a bettor assesses Y’s odds as 5:1, it’s a good bet. Yes, the horse is not probable to win. However, the payout is greater than the odds. Given enough bets with 5:1 odds and 10;1 payouts, a bettor will win in the long run.
We admit to not knowing much about betting at racetracks. There may be lots of reasons why this scheme is not practical (not least of which is being accurate in assessing odds for each horse). That’s not the point, and we certainly don’t recommend anyone to start betting on horse racing.
Focus on spreads
The point is that the “house” focuses on spreads. Sophisticated operators focus on spread. You should focus on spread too.
Mainstream analysis often dismiss gold as having no value, on grounds that they know not how to assess it. Gold bugs often like to divide some measure of the quantity of dollars by some measure of the quantity of gold to get an intrinsic value. This exercise in arithmetic usually shows that gold is massively underpriced.
Both approaches are equally wrong.
The fact is that virtually all of the gold mined over the millennia is still in human hands. The proportion for silver is lower, but still orders and orders of magnitude greater than that of any other commodity. This means that the people on this planet do value gold and silver, without much regard to quantity already held. The value they place on the metals can be measured at the margin. How?
By studying spreads.
We can theorize that people will value gold and silver more highly (i.e. value the dollar at a much lower level). But that is not a measurement of the current market reality. It is speculation. Perhaps smart speculation. It may even be based on sound economics. But it’s nothing to do with the current market and supply and demand conditions within it.
…
Monday was a holiday in the US (Labor Day), so it was a short week.
The prices of the metals went down, with the gold move slightly larger than the silver. Yes, but what happened to the spreads of the metals this week? Read on…
First, here is the graph of the metals’ prices.
The Prices of Gold and Silver
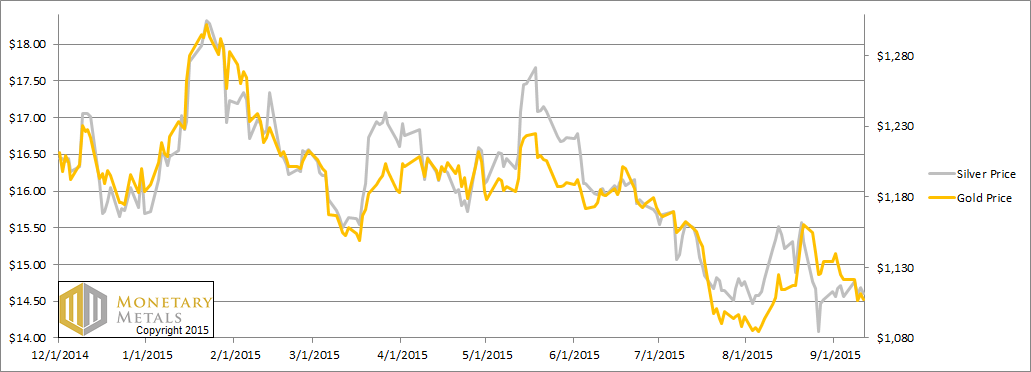
We are interested in the changing equilibrium created when some market participants are accumulating hoards and others are dishoarding. Of course, what makes it exciting is that speculators can (temporarily) exaggerate or fight against the trend. The speculators are often acting on rumors, technical analysis, or partial data about flows into or out of one corner of the market. That kind of information can’t tell them whether the globe, on net, is hoarding or dishoarding.
One could point out that gold does not, on net, go into or out of anything. Yes, that is true. But it can come out of hoards and into carry trades. That is what we study. The gold basis tells us about this dynamic.
Conventional techniques for analyzing supply and demand are inapplicable to gold and silver, because the monetary metals have such high inventories. In normal commodities, inventories divided by annual production (stocks to flows) can be measured in months. The world just does not keep much inventory in wheat or oil.
With gold and silver, stocks to flows is measured in decades. Every ounce of those massive stockpiles is potential supply. Everyone on the planet is potential demand. At the right price, and under the right conditions. Looking at incremental changes in mine output or electronic manufacturing is not helpful to predict the future prices of the metals. For an introduction and guide to our concepts and theory, click here.
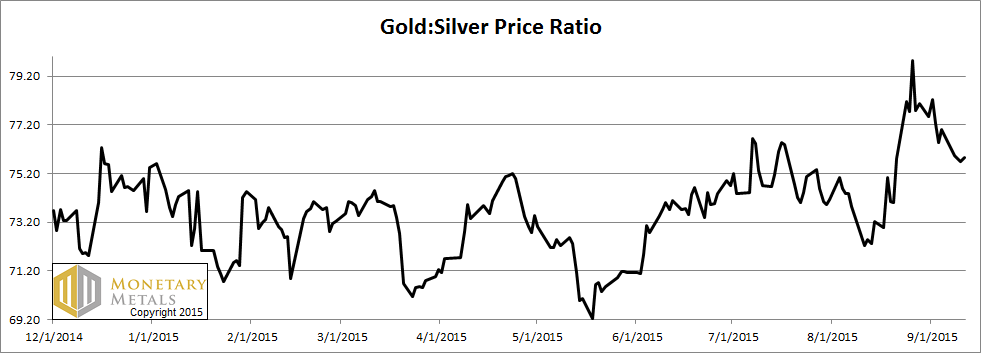
Next, this is a graph of the gold price measured in silver, otherwise known as the gold to silver ratio. The ratio moved down again this week. Is it bouncing off support, or just correcting before it goes higher? Read on…
The Ratio of the Gold Price to the Silver Price
For each metal, we will look at a graph of the basis and cobasis overlaid with the price of the dollar in terms of the respective metal. It will make it easier to provide brief commentary. The dollar will be represented in green, the basis in blue and cobasis in red.
Here is the gold graph.
The Gold Basis and Cobasis and the Dollar Price
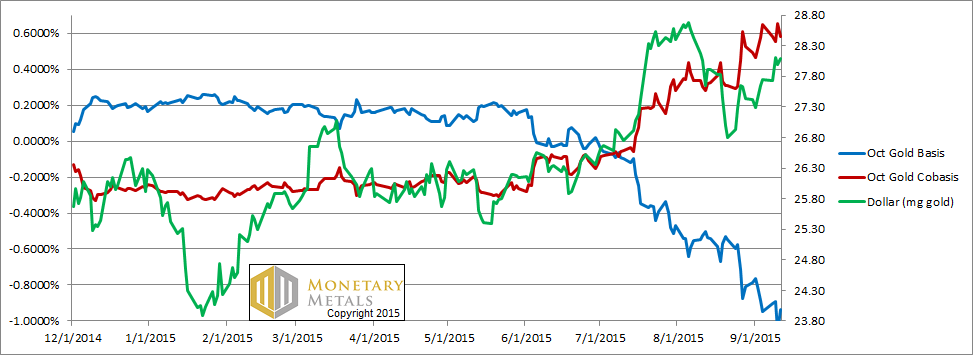
The price of the dollar rose slightly, but the scarcity (i.e. cobasis) of gold backed off slightly. At least for the October contract.
The fundamental price did not move much. It’s still over $1,270.
Now let’s look at silver.
The Silver Basis and Cobasis and the Dollar Price
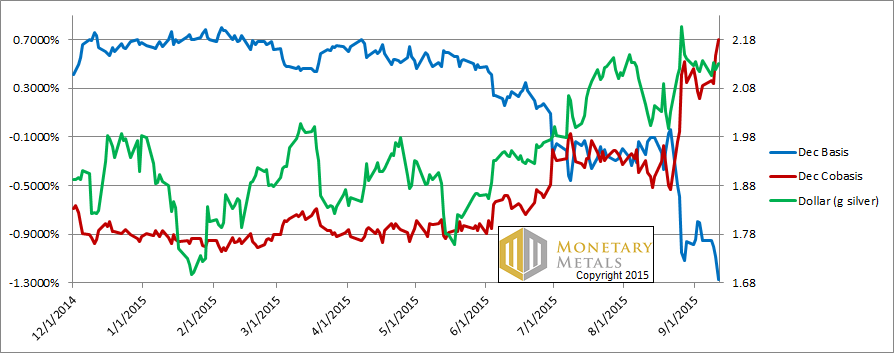
While the price of the dollar went up (i.e. the price of silver, measured in dollars went down) the scarcity rose.
The silver fundamental price rose, and is now about a dollar over the market price.
The fundamental ratio moved down slightly, but is still over 80.
Monetary Metals may sponsor an event in London in early October, and another in Sydney in late October, to discuss economics and markets, with a focus on how to approach saving, investing, and speculating. Please let us know if you may be interested in attending either one here.
See more for
