Thursday , November 14 2024
Home / Flavio Tosti

Flavio Tosti


Articles by Flavio Tosti

USD/CHF Price Analysis: US dollar bulls nearing 0.9700 handle vs. Swiss franc

April 2, 2020

USD/CHF is trading up for the third consecutive day. 
The level to beat for bulls is the 0.9700 resistance.
USD/CHF daily chart
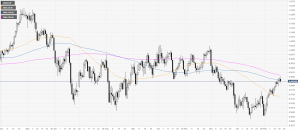
USD/CHF is rebounding from the 0.9500 level while challenging the 50 SMA on the daily chart. DXY (US dollar index) is gaining some ground vs. most of its rivals.

USD/CHF daily chart(see more posts on USD/CHF, ) – Click to enlarge

USD/CHF four-hour chart
The spot is about to challenge the 0.9700 figure while trading above the 100/200 SMAs on the four-hour chart. A break beyond the above-mentioned level would be necessary for bulls to extend the current bull move towards the 0.9800 and 0.9900 price levels on the way up. Support can emerge near the 0.9600, 0.9550 and 0.9500 price levels on any retracement.

USD/CHF four-hour chart(see

Read More »
USD/CHF Price Analysis: Dollar easing further from monthly tops, approaching 0.9600 figure vs. CHF

March 27, 2020

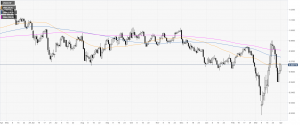
USD/CHF is trading down for the fourth consecutive day.
The level to beat for bears is the 0.9600 support.
USD/CHF daily chart
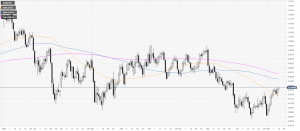
USD/CHF is easing from the monthly highs as the spot drops below the main SMAs on the daily chart. The US dollar is down against most currencies this Thursday.

USD/CHF daily chart – Click to enlarge

USD/CHF four-hour chart
The spot is pulling back down while nearing the 0.9600 figure below the 200 SMA on the four-hour chart. Bears could continue to extend the decline towards the 0.9550 and 0.9540 levels while the 0.9700 and 0.9800 figures could become resistance on bullish attempts.

USD/CHF four-hour chart – Click to enlarge

You Might Also Like

USD/CHF Price Analysis:

Read More »

USD/CHF Price Analysis: US dollar eases from 2020 highs, stabilizes near 0.9800 figure

March 24, 2020

USD/CHF consolidates gains for the second consecutive day. 
The level to beat for bulls is the 0.9900 resistance.
The parity level might be on the bulls’ radar.
USD/CHF daily chart
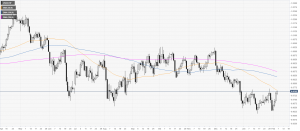
USD/CHF is retreating slightly this Monday while the currency pair is consolidating gains for the second consecutive day above the main SMAs. The Fed extended its Quantitative Easing program with an initial reaction down on the US dollar which was relatively limited on USD/CHF and across the board.

USD/CHF daily chart(see more posts on USD/CHF, ) – Click to enlarge

USD/CHF four-hour chart
The uptrend remains intact as the spot is trading above the main SMAs. Bulls are looking for a break above the 0.9900 figure for a potential run to the parity level (1.0000) followed by the

Read More »

USD/CHF Price Analysis: Dollar trading in fresh March’s highs, challenging 0.9750 level

March 19, 2020

USD/CHF is reversing up sharply from the 2020 lows. 
The level to beat for bulls is the 0.9750 resistance.
USD/CHF daily chart
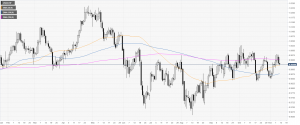
USD/CHF is rebounding sharply from 2020 lows while nearing the 100 SMA on the daily chart. The demand for the greenback is dring the currency pair towards the 2020 highs.

USD/CHF daily chart(see more posts on USD/CHF, ).

USD/CHF four-hour chart
The spot spiked to the upside while reaching new March’s highs while trading above the main SMAs. Bulls would need to break above the 0.9750 resistance and if the market is able to pierce through it, USD/CHF might be headed towards the 0.9850 and 0.9950 levels over time. On the way down the market might find support near the 0.9650, 0.9600 and 0.9550 levels.

USD/CHF four-hour chart – Click to

Read More »

USD/CHF Price Analysis: Dollar bouncing after falling to three-week’s lows, trades above 0.9700 figure

February 28, 2020

USD/CHF is bouncing from daily lows while nearing the 0.9730 resistance.
As the bounce can be short-lived, the level to beat for sellers remains the 0.9680 level
USD/CHF daily chart
USD/CHF is trading below the main daily simple moving averages suggesting an overall bearish bias in the long term. The spot is just below the 50 SMA.

USD/CHF daily chart(see more posts on USD/CHF, ) – Click to enlarge

USD/CHF four-hour chart
As expected the spot reached the 0.9680 level from which it is now having a rebound. Bears remain in control as USD/CHF trades below the main SMAs. A break below the 0.9680 support can lead to further losses towards the 0.9630 level. Resistance is seen near 0.9730 and 0.9770 levels.
Resistance: 0.9730, 0.9770, 0.9800
Support: 0.9710, 0.9680,

Read More »

USD/CHF New York Price Analysis: Dollar eases from session highs, trades below 0.9830 vs. Swiss franc

February 20, 2020

USD/CHF prints another 2020 high and retraces down in the New York session.
Bears are challenging the 0.9830 level. 
USD/CHF daily chart
After hitting yet again a new 2020 high, USD/CHF is easing from session highs. The spot is trading below the 200-day simple moving averages suggesting an overall bearish momentum in the long term.

USD/CHF daily chart(see more posts on USD/CHF, ) – Click to enlarge

USD/CHF four-hour chart
Dollar/Swiss is trading in a rising wedge while challenging the 0.9830 support. Bears want a daily close below the 0.9830 level and the trendline and target the 0.9800 and 0.9770 levels. On the flip side bulls remain in control for now and are looking for a daily break above the 0.9850 level to hit 0.9870 and the 0.9900 figure.
Resistance:

Read More »

USD/CHF Price Analysis: Greenback grinding up vs. Swiss franc, clings to 2020 highs

February 14, 2020

USD/CHF is slowly advancing printing fresh 2020 highs by a few pips.
The rising wedge formations can limit the upside on USD/CHF. 
USD/CHF daily chart
USD/CHF is printing new 2020 highs while the quote is trading below the 100/200-day simple moving averages suggesting an overall bearish momentum.

USD/CHF daily chart(see more posts on USD/CHF, ) – Click to enlarge

USD/CHF four-hour chart
After USD/CHF broke below the rising wedge pattern the market made a retest of the high creating a higher high by a few pips just below the 0.9800 figure. The spot is also trading within a larger rising wedge pattern which can be seen as potentially bearish if the bears start to show some signs of conviction. In fact, bears want to weaken the market and trade below the 0.9770

Read More »

USD/CHF Price Analysis: Rising wedge can halt the bulls

February 12, 2020

USD/CHF created a rising wedge pattern suggesting potential exhaustion in the medium term.
The level to beat for bears is the 0.9770 support.  
USD/CHF daily chart
USD/CHF is pulling back down slightly from the 2020 highs while reintegrating Friday’s range. The spot is trading below the 100/200-day simple moving averages suggesting an overall bearish bias.

USD/CHF daily chart(see more posts on USD/CHF, ) – Click to enlarge

USD/CHF four-hour chart
USD/CHF is trading in a rising wedge pattern suggesting the market might be exhausting itself. If the bears break the 0.9770 support on a daily basis, the spot could decline towards the 0.9730 and 0.9710 price levels. On the flip side, if the buyers surpass the 0.9800 figure the quote could continue trending to the

Read More »

USD/CHF Price Analysis: Greenback approaching January highs vs. Swiss franc

February 8, 2020

USD/CHF created a strong bullish recovery while nearing the 2020 highs. 
The level to beat for bulls is the 0.9770 resistance.  
USD/CHF daily chart
USD/CHF is attempting to form a base near multi-month lows while trading below the main daily simple moving averages.

USD/CHF daily chart(see more posts on USD/CHF, ) – Click to enlarge

USD/CHF four-hour chart
The market is nearing the January highs while trading above the main SMAs. Bulls want a break above the 0.9770 resistance on a daily closing basis in order to send the market up towards the 0.9800 figure and 0.9828 price level. Support is seen near the 0.9727, 0.9710 and 0.9676 levels, according to the Technical Confluences Indicator.
Resistance: 0.9770, 0.9800, 0.9828
Support: 0.9727, 0.9710, 0.9676

Read More »

USD/CHF technical analysis: Greenback loses steam against Swissy, trades near 0.9930 level

November 13, 2019

USD/CHF erased its intraday gains, settling near the 0.9930 level. 
Support is seen at the 0.9920 level.
USD/CHF daily chart
On the daily chart, USD/CHF is trading in a range below its 200-day simple moving average (DMA). The spot is holding just above the 50 SMA today at the 0.9921 level.

USD/CHF daily chart(see more posts on USD/CHF, ) – Click to enlarge

USD/CHF four-hour chart

USD/CHF is retracing down from the current November highs while challenging the 0.9920 level and 200 SMA. If the buyers give up, the spot can continue to decline towards the 0.9899 and 0.9855 support levels, according to the Technical Confluences Indicator. 

USD/CHF four-hour chart(see more posts on USD/CHF, ) – Click to enlarge

USD/CHF 30-minute chart
USD/CHF is trading

Read More »

USD/CHF technical analysis: Greenback hanging near the November highs against CHF

November 7, 2019

USD/CHF is trading flat on the day, consolidating the gains of the last two days. 
The level to beat for bulls is the 0.9940/0.9956 resistance zone.
USD/CHF daily chart
On the daily chart, USD/CHF is trading in a range below its 200-day simple moving average (DMA). The market is holding just above the 50 SMA today at the 0.9916 level.

USD/CHF daily chart(see more posts on USD/CHF, ) – Click to enlarge

USD/CHF four-hour chart
USD/CHF is trading near the monthly highs while above its main SMAs, suggesting a bullish bias in the medium term. Buyers will need to overcome the 0.9940/0.9956 resistance zone and the descending trendline. Further up, 0.9988 resistance awaits, according to the Technical Confluences Indicator.

USD/CHF four-hour chart(see more posts on

Read More »

USD/CHF technical analysis: Greenback nearing the October lows, consolidating near 0.9870 level

November 1, 2019

USD/CHF is consolidating its losses this Thursday.
The level to beat for bears is the 0.9855 support.
USD/CHF daily chart
On the daily chart, USD/CHF is trading in a range below its main daily simple moving averages (DSMAs). The market is approaching the October low, currently at the 0.9837 price level.

USD/CHF daily chart(see more posts on USD/CHF, ) – Click to enlarge

USD/CHF four-hour chart

USD/CHF is under bearish pressure below its main SMAs as the market is nearing the 0.9855 support level. A break below this level can lead to an extension of the current bear leg towards the 0.9798 price level, according to the Technical Confluences Indicator. 

USD/CHF four-hour chart(see more posts on USD/CHF, ) – Click to enlarge

USD/CHF 30-minute chart

Read More »

USD/CHF technical analysis: Greenback hits fresh October lows against the Swiss Franc

October 19, 2019

USD/CHF remains under heavy pressure after the London close. 
The level to beat for bears is the 0.9871 level. 
USD/CHF daily chart
On the daily chart, USD/CHF is trading in a sideways trend, now challenging the 50 and 100-day simple moving averages (DSMAs) below the 0.9900 handle.

USD/CHF daily chart(see more posts on USD/CHF, ) – Click to enlarge

USD/CHF four-hour chart

USD/CHF is under bearish pressure below the main SMAs as the market is trading at its lowest point since late September. A continuation of the bear move below the 0.9871 support can lead to an acceleration towards 0.9850 and 0.9830 price levels, according to the Technical Confluences Indicator.

USD/CHF four-hour chart(see more posts on USD/CHF, ) – Click to enlarge

USD/CHF 30-minute

Read More »

USD/CHF technical analysis: Greenback jumps and settles above 0.9726 as tariffs gets delayed

August 14, 2019

USD/CHF daily chart
USD/CHF is trading off 2-month lows below the main daily simple moving averages (DSMAs). US equity markets are rising sharply as US tariffs are to be delayed to December 15. The news was perceived as risk-on, sending safe-haven CHF, JPY and gold down.

USD/CHF daily chart, August 14(see more posts on USD/CHF, ) – Click to enlarge

USD/CHF 4-hour chart
USD/CHF broke through several resistance levels but is still trading below its main SMAs. Bears would need to recapture 0.9726 and 0.9694 support to reverse the bullish surprise.

USD/CHF 4-hour chart, August 14(see more posts on USD/CHF, ) – Click to enlarge

USD/CHF 30-minute chart
USD/CHF is trading above its main SMAs, suggesting bullish pressure in the near term. The move up is

Read More »

USD/CHF technical analysis: Greenback under pressure below 0.9700 as sellers challenge June lows

August 13, 2019

CHF is up as Wall Street indices start the week in the red. 
The level to beat for bears are at the 0.9675 and 0.9660 levels.

USD/CHF daily chart
USD/CHF is trading near 2-month lows below the main daily simple moving averages (DSMAs). US equity markets are starting the week on the back foot, driving demand for safe-haven currencies such as the Swiss franc.

USD/CHF daily chart, August 13(see more posts on USD/CHF, ) – Click to enlarge

USD/CHF 4-hour chart
USD/CHF is creeping lower while trading below its main SMAs. Bears want to reach 0.9675 and 0.9660 on the way down, according to the Technical Confluences Indicator.

USD/CHF 4-hour chart, August 13(see more posts on USD/CHF, ) – Click to enlarge

USD/CHF

Read More »

USD/CHF technical analysis: Greenback stable near 0.9755 as US stocks recover

August 11, 2019

The demand for the Swiss franc decreases as Wall Street indices are gaining strength. 
The level to beat for bulls are at 0.9790 and 0.9815 level.

USD/CHF daily chart
USD/CHF is trading off 2-month lows below the main daily simple moving averages (DSMAs). Equity markets are recovering from the recent selloff easing the demand for safe-haven currencies such as CHF and JPY.

USD/CHF daily chart – Click to enlarge

USD/CHF 4-hour chart
USD/CHF is bouncing from monthly lows while trading below its main SMAs. Bulls need a clear break above 0.9790 to reach 0.9815 resistance on the way up.

USD/CHF 4-hour chart – Click to enlarge

USD/CHF 30-minute chart
USD/CHF is trading just above the 50 and 100 SMA, suggesting a

Read More »