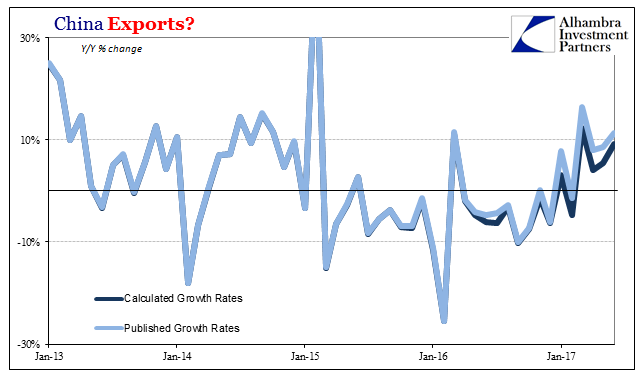
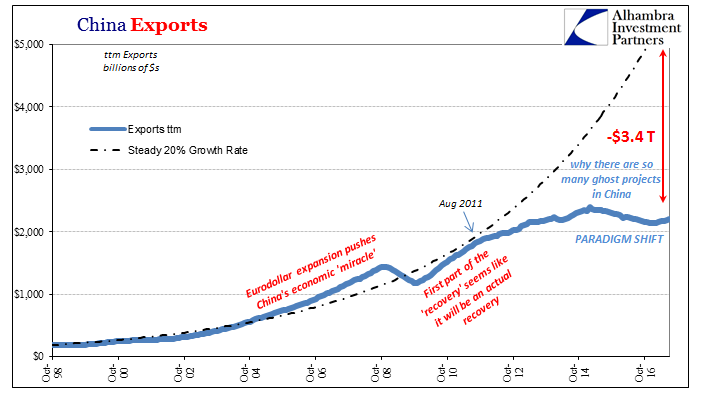
China’s export growth disappointed in July, only we don’t really know by how much. According to that country’s Customs Bureau, exports last month were 7.2% above (in US$ terms) exports in July 2016. That’s down from 11.3% growth in June, which as usual had been taken in the mainstream as evidence of “strong” or “robust” global demand. According to China’s National Bureau of Statistics, however, exports in June rose by both 11.3% as well as 9.1%. The reason for the confusion is disharmony in their data. If you select their export data to be displayed by growth rate, the NBS database shows 11.3% for June 2017. If instead you, as I do, extract the export estimates by dollar amounts, the NBS gives you total exports of
Topics:
Jeffrey P. Snider considers the following as important: China, China Exports, China Imports, currencies, Customs Bureau, economy, EuroDollar, exports, Featured, Federal Reserve/Monetary Policy, global money, global trade, imports, Markets, NBS, newslettersent, Statistics, trade
This could be interesting, too:
Nachrichten Ticker - www.finanzen.ch writes Die Performance der Kryptowährungen in KW 9: Das hat sich bei Bitcoin, Ether & Co. getan
Nachrichten Ticker - www.finanzen.ch writes Wer verbirgt sich hinter der Ethereum-Technologie?
Marc Chandler writes March 2025 Monthly
Mark Thornton writes Is Amazon a Union-Busting Leviathan?
| China’s export growth disappointed in July, only we don’t really know by how much. According to that country’s Customs Bureau, exports last month were 7.2% above (in US$ terms) exports in July 2016. That’s down from 11.3% growth in June, which as usual had been taken in the mainstream as evidence of “strong” or “robust” global demand.
According to China’s National Bureau of Statistics, however, exports in June rose by both 11.3% as well as 9.1%. The reason for the confusion is disharmony in their data. If you select their export data to be displayed by growth rate, the NBS database shows 11.3% for June 2017. If instead you, as I do, extract the export estimates by dollar amounts, the NBS gives you total exports of $196.59 billion. For June 2016, the NBS shows $180.18 billion in Chinese exports. Simple math yields a 9.1% growth rate, not 11.3%. There has always been some disagreement in these figures going all the way back. They were until this year small enough so as to be trivial. For the important month of October 2015, for example, the published growth rate was -6.9% where the calculated growth rate was 7.0%. In the next month, November, the difference was slightly larger, -6.8% published versus -7.2% calculated. To that point, November 2015’s was actually the largest disparity. |
China Exports 2013-2017(see more posts on China Exports, ) |
| I’ve sent queries to both the NBS as well as the Customs Bureau but have received no responses. There is no as yet published explanation for the difference or the timing (which I can’t help but find interesting in the context of CNY).
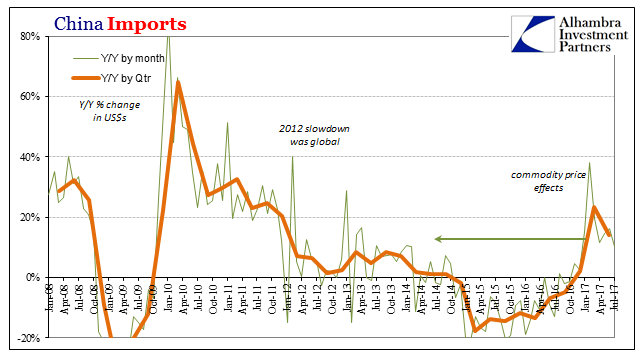
This problem does occur on the import side, but unlike exports in a more consistent, trivial fashion like it used to be before 2017 on that other side. Chinese imports in July rose only 10.3%, a quarter of the rate from February when commodity price base effects were their largest. At around 10% or even 20%, that’s not nearly enough expansion to offset what was five straight quarters of serious contraction around -15%. |
China Imports 2008-2017(see more posts on China Imports, ) |
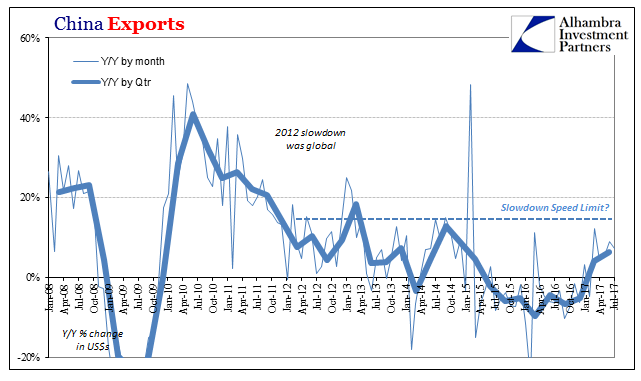
| Even if we don’t know to what degree, the same is true for exports. Demand levels in an otherwise healthy (seeming) global economy would yield export levels closer to the pre-crisis range than stuck around 10% or possibly less. That growth rate is exceedingly deficient on its own, let alone following more than a year after a severe downturn where Chinese exports contracted for seven quarters. |
China Exports 2008-2017(see more posts on China Exports, ) |
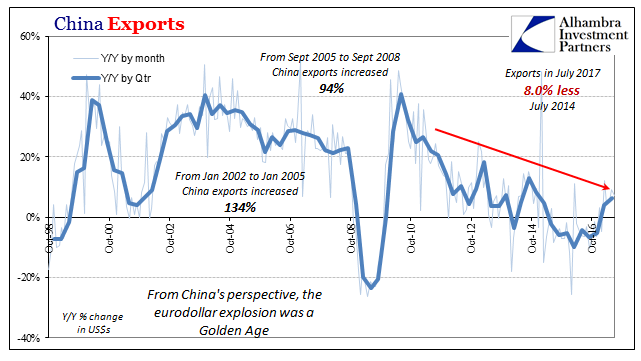
| Total exports were, as of now, 8% less than those in July 2014 three years ago. That is not expansion in any meaningful sense of the word, a distinction that gets lost in the focus on the plus sign at the expense of the degree of it in relation to context.
This is more than just a historical oddity. It tells us what to expect in the near future and how that could further evolve according to a more reasonable analysis of the global economic trend. The lack of momentum as well as the lack of success in inflation are together indications of the same thing. The trade figures tell us of a persistent economic drag that won’t go away even after heavy cyclical forces on the upturn should have been evident long before now. |
China Exports 1998-2017(see more posts on China Exports, ) |
| The inflation piece merely indicates what it is that is causing the drag. This is all textbook monetary tightness, which unfortunately has been corrupted in mainstream, conventional terms. The popular imagination assigns October 1929 to March 1933 as the only possible result of such tightness, therefore if the global economy and every single market is not all at once experiencing a great crash a monetary issue is immediately overlooked and dismissed.
Milton Friedman, the presumed father of monetarism, described how this was a false assumption in the course of destroying (as the kids say) the idea that low rates are somehow stimulus. And this was 1967, meaning he was making a prediction that within just a few more years was empirically settled for all time (or so it should have been):
We have today around the world all the same signs; low interest rates, low inflation rates relative to specified targets, and economic growth that has been overall seriously deficient as well as more recently unable to break out of that state despite what otherwise seems to be everything going for it to do so. Until the issue of monetary tightness is resolved not for the US or dollars, but for “dollars” meaning global money, there should be no expectation for a change in economic conditions, even if we don’t know exactly how far from healthy they may be. |
China Exports 1998-2017(see more posts on China Exports, ) |
Tags: China,China Exports,China Imports,currencies,Customs Bureau,economy,EuroDollar,exports,Featured,Federal Reserve/Monetary Policy,global money,global trade,imports,Markets,NBS,newslettersent,statistics,Trade

