Durable and capital goods orders and shipments all increased in December by growth rates consistent with those registered in the months leading up to the big storms Harvey and Irma. We continue to find evidence that accelerated growth in October and November was nothing more than the anticipated after-effects cleaning up after those hurricanes. New orders for durable goods (excluding transportation orders) had increased year-over-year (unadjusted) by 6.2%, 6.8%, 6.6%, and 6.7% in the four months June to September, respectively. In October, orders picked up to 9.8%, followed by a gain of 8.8% in November. The most recent estimates put December at once more 6.7%. US Durable Goods Order, Jan 1993 - 2018(see more posts
Topics:
Jeffrey P. Snider considers the following as important: capital goods, currencies, durable goods, economy, Featured, Federal Reserve/Monetary Policy, hurricanes, Markets, newslettersent, The United States
This could be interesting, too:
Nachrichten Ticker - www.finanzen.ch writes Die Performance der Kryptowährungen in KW 9: Das hat sich bei Bitcoin, Ether & Co. getan
Nachrichten Ticker - www.finanzen.ch writes Wer verbirgt sich hinter der Ethereum-Technologie?
Marc Chandler writes March 2025 Monthly
Mark Thornton writes Is Amazon a Union-Busting Leviathan?
| Durable and capital goods orders and shipments all increased in December by growth rates consistent with those registered in the months leading up to the big storms Harvey and Irma. We continue to find evidence that accelerated growth in October and November was nothing more than the anticipated after-effects cleaning up after those hurricanes.
New orders for durable goods (excluding transportation orders) had increased year-over-year (unadjusted) by 6.2%, 6.8%, 6.6%, and 6.7% in the four months June to September, respectively. In October, orders picked up to 9.8%, followed by a gain of 8.8% in November. The most recent estimates put December at once more 6.7%. |
US Durable Goods Order, Jan 1993 - 2018(see more posts on U.S. Durable Goods Orders, )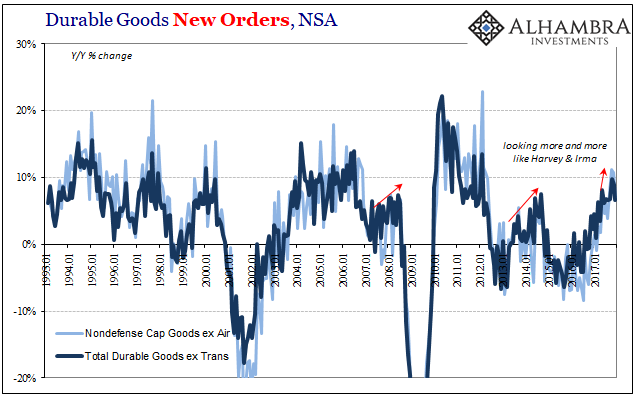 - Click to enlarge |
| The same trend has worked out in capital goods. Shipments (excluding defense and aircraft shipments) had increased by 4.5%, 7.2%, 7.4%, and 6.6%, in the summer months on through to September. Growth accelerated to 11.4% and 10.1% in October and November, respectively. For December, the year-over-year change slowed down back to 6.8%.
The seasonally-adjusted version for capital goods shipments highlights the anomaly. |
US Nondefense Capital Goods, Jan 2005 - 2018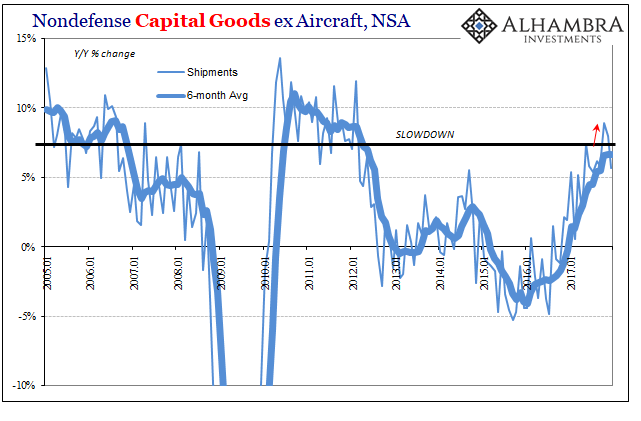 - Click to enlarge |
| As with the housing data for December, durable goods estimates all lean in the direction of distortion rather than meaningful acceleration. These growth rates outside of October and November are consistent with the same lackluster growth we’ve been stuck with since 2012. As Q4 GDP declared for yet another quarter, nothing has changed. In fact, the BEA figure for GDP managed only 2.6% during that one despite these storm effects packed heavily into the first two months of that quarter. |
US Non-defense Capital Goods, Jan 2013 - 2018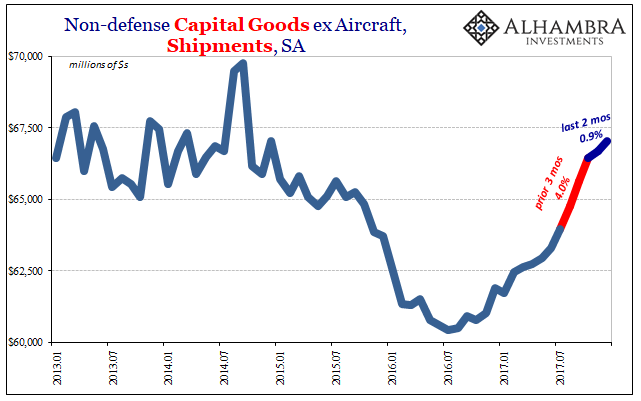 - Click to enlarge |
Tags: capital goods,currencies,durable goods,economy,Featured,Federal Reserve/Monetary Policy,hurricanes,Markets,newslettersent